Research Methods
Chapter 2 introduction.
Maybe you have already gained some experience in doing research, for example in your bachelor studies, or as part of your work.
The challenge in conducting academic research at masters level, is that it is multi-faceted.
The types of activities are:
- Finding and reviewing literature on your research topic;
- Designing a research project that will answer your research questions;
- Collecting relevant data from one or more sources;
- Analyzing the data, statistically or otherwise, and
- Writing up and presenting your findings.
Some researchers are strong on some parts but weak on others.
We do not require perfection. But we do require high quality.
Going through all stages of the research project, with the guidance of your supervisor, is a learning process.
The journey is hard at times, but in the end your thesis is considered an academic publication, and we want you to be proud of what you have achieved!
Probably the biggest challenge is, where to begin?
- What will be your topic?
- And once you have selected a topic, what are the questions that you want to answer, and how?
In the first chapter of the book, you will find several views on the nature and scope of business research.
Since a study in business administration derives its relevance from its application to real-life situations, an MBA typically falls in the grey area between applied research and basic research.
The focus of applied research is on finding solutions to problems, and on improving (y)our understanding of existing theories of management.
Applied research that makes use of existing theories, often leads to amendments or refinements of these theories. That is, the applied research feeds back to basic research.
In the early stages of your research, you will feel like you are running around in circles.
You start with an idea for a research topic. Then, after reading literature on the topic, you will revise or refine your idea. And start reading again with a clearer focus ...
A thesis research/project typically consists of two main stages.
The first stage is the research proposal .
Once the research proposal has been approved, you can start with the data collection, analysis and write-up (including conclusions and recommendations).
Stage 1, the research proposal consists of he first three chapters of the commonly used five-chapter structure :
- Chapter 1: Introduction
- An introduction to the topic.
- The research questions that you want to answer (and/or hypotheses that you want to test).
- A note on why the research is of academic and/or professional relevance.
- Chapter 2: Literature
- A review of relevant literature on the topic.
- Chapter 3: Methodology
The methodology is at the core of your research. Here, you define how you are going to do the research. What data will be collected, and how?
Your data should allow you to answer your research questions. In the research proposal, you will also provide answers to the questions when and how much . Is it feasible to conduct the research within the given time-frame (say, 3-6 months for a typical master thesis)? And do you have the resources to collect and analyze the data?
In stage 2 you collect and analyze the data, and write the conclusions.
- Chapter 4: Data Analysis and Findings
- Chapter 5: Summary, Conclusions and Recommendations
This video gives a nice overview of the elements of writing a thesis.

Key Concepts in Quantitative Research
In this module, we are going to explore the nuances of quantitative research, including the main types of quantitative research, more exploration into variables (including confounding and extraneous variables), and causation.
Content includes:
- Flaws, “Proof”, and Rigor
- The Steps of Quantitative Methodology
- Major Classes of Quantitative Research
- Experimental versus Non-Experimental Research
- Types of Experimental Research
- Types of Non-Experimental Research
- Research Variables
- Confounding/Extraneous Variables
- Causation versus correlation/association
Objectives:
- Discuss the flaws, proof, and rigor in research.
- Describe the differences between independent variables and dependent variables.
- Describe the steps in quantitative research methodology.
- Describe experimental, quasi-experimental, and non-experimental research studies
- Describe confounding and extraneous variables.
- Differentiate cause-and-effect (causality) versus association/correlation
Flaws, Proof, and Rigor in Research
One of the biggest hurdles that students and seasoned researchers alike struggle to grasp, is that research cannot “ prove ” nor “ disprove ”. Research can only support a hypothesis with reasonable, statistically significant evidence.
Indeed. You’ve heard it incorrectly your entire life. You will hear professors, scientists, radio ads, podcasts, and even researchers comment something to the effect of, “It has been proven that…” or “Research proves that…” or “Finally! There is proof that…”
We have been duped. Consider the “ prove ” word a very bad word in this course. The forbidden “P” word. Do not say it, write it, allude to it, or repeat it. And, for the love of avocados and all things fluffy, do not include the “P” word on your EBP poster. You will be deducted some major points.
We can only conclude with reasonable certainty through statistical analyses that there is a high probability that something did not happen by chance but instead happened due to the intervention that the researcher tested. Got that? We will come back to that concept but for now know that it is called “statistical significance”.
All research has flaws. We might not know what those flaws are, but we will be learning about confounding and extraneous variables later on in this module to help explain how flaws can happen.
Remember this: Sometimes, the researcher might not even know that there was a flaw that occurred. No research project is perfect. There is no 100% awesome. This is a major reason why it is so important to be able to duplicate a research project and obtain similar results. The more we can duplicate research with the same exact methodology and protocols, the more certainty we have in the results and we can start accounting for flaws that may have sneaked in.
Finally, not all research is equal. Some research is done very sloppily, and other research has a very high standard of rigor. How do we know which is which when reading an article? Well, within this module, we will start learning about some things to look for in a published research article to help determine rigor. We do not want lazy research to determine our actions as nurses, right? We want the strongest, most reliable, most valid, most rigorous research evidence possible so that we can take those results and embed them into patient care. Who wants shoddy evidence determining the actions we take with your grandmother’s heart surgery?
Independent Variables and Dependent Variables
As we were already introduced to, there are measures called “variables” in research. This will be a bit of a review but it is important to bring up again, as it is a hallmark of quantitative research. In quantitative studies, the concepts being measured are called variables (AKA: something that varies). Variables are something that can change – either by manipulation or from something causing a change. In the article snapshots that we have looked at, researchers are trying to find causes for phenomena. Does a nursing intervention cause an improvement in patient outcomes? Does the cholesterol medication cause a decrease in cholesterol level? Does smoking cause cancer?
The presumed cause is called the independent variable. The presumed effect is called the dependent variable. The dependent variable is “dependent” on something causing it to change. The dependent variable is the outcome that a researcher is trying to understand, explain, or predict.
Think back to our PICO questions. You can think of the intervention (I) as the independent variable and the outcome (O) as the dependent variable.
The independent variable is manipulated by the researcher or can be variants of influence. Whereas the dependent variable is never manipulated.

Variables do not always measure cause-and-effect. They can also measure a direction of influence.
Here is an example of that: If we compared levels of depression among men and women diagnosed with pancreatic cancer and found men to be more depressed, we cannot conclude that depression was caused by gender. However, we can note that the direction of influence clearly runs from gender to depression. It makes no sense to suggest the depression influenced their gender.
In the above example, what is the independent variable (IV) and what is the dependent variable (DV)? If you guessed gender as the IV and depression as the DV, you are correct! Important to note in this case that the researcher did not manipulate the IV, but the IV is manipulated on its own (male or female).
Researchers do not always have just one IV. In some cases, more than one IV may be measured. Take, for instance, a study that wants to measure the factors that influence one’s study habits. Independent variables of gender, sleep habits, and hours of work may be considered. Likewise, multiple DVs can be measured. For example, perhaps we want to measure weight and abdominal girth on a plant-based diet (IV).
Now, some studies do not have an intervention. We will come back to that when we talk about non-experimental research.
The point of variables is so that researchers have a very specific measurement that they seek to study.
Let’s look at a couple of examples:
| Study | Independent Variable(s)(Intervention/Treatment) | Dependent Variable(s)(Effect/Results) |
| An analysis of emotional intelligence in nursing leaders—focuses on the meaning of emotional intelligence specific to nurses—defines emotional intelligence, the consequences, and antecedents. A literature review is used to find information about the meaning, consequences, and antecedents of emotional intelligence. | None – there is no intervention | The definition of emotional intelligence. The antecedents of emotional intelligence. |
| : In this study, nurses use protocol hand hygiene for their own hands and patient hands to examine if the hand hygiene protocol will decrease hospital-acquired infections in the Intensive Care Unit. | Hand hygiene for nurses and patients. Nurse in-service training on hand hygiene for nurses and patients. | Hospital-acquired infection rates in the ICU. |
Now you try! Identify the IVs and DVs:
| Study | Independent Variable(s)(Intervention/Treatment) | Dependent Variable(s)(Effect/Results) |
| : A nurse wants to know if extra education about healthy lifestyles with a focus on increasing physical activity with adolescents will increase their physical activity levels and impact their heart rates and blood pressures over a 6-month time. Data is collected before intervention and after intervention at multiple intervals. A control group and intervention group is used. Randomized assignment to groups is used. (True Experimental design with intervention group, control group, and randomization.) |
|
|
| : Playing classical music for college students was examined to study if it impacts their grades—music was played for college students in the study and their post music grades were compared to their pre-music grades. |
|
|
| : A nurse researcher studies the lived experiences of registered nurses in their first year of nursing practice through a one-on-one interview. The nurse researcher records all the data and then has it transcribes to analysis themes that emerge from the 28 nurses interviewed. |
|
|
IV and DV Case Studies (Leibold, 2020)
Case Three: Independent variable: Healthy Lifestyle education with a focus on physical activity; Dependent variable: Physical activity rate before and after education intervention, Heart rate before and after education intervention, Blood pressures before and after education intervention.
Case Four: Independent variable: Playing classical music; Dependent variable: Grade point averages post classical music, compared to pre-classical music.
Case Five: Independent variable: No independent variable as there is no intervention. Dependent variable: The themes that emerge from the qualitative data.
The Steps in Quantitative Research Methodology
Now, as we learned in the last module, quantitative research is completely objective. There is no subjectivity to it. Why is this? Well, as we have learned, the purpose of quantitative research is to make an inference about the results in order to generalize these results to the population.
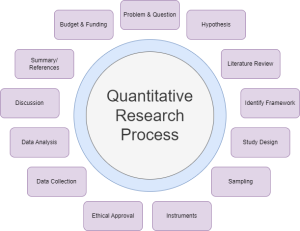
In quantitative studies, there is a very systematic approach that moves from the beginning point of the study (writing a research question) to the end point (obtaining an answer). This is a very linear and purposeful flow across the study, and all quantitative research should follow the same sequence.
- Identifying a problem and formulating a research question . Quantitative research begins with a theory . As in, “something is wrong and we want to fix it or improve it”. Think back to when we discussed research problems and formulating a research question. Here we are! That is the first step in formulating a quantitative research plan.
- Formulate a hypothesis . This step is key. Researchers need to know exactly what they are testing so that testing the hypothesis can be achieved through specific statistical analyses.
- A thorough literature review . At this step, researchers strive to understand what is already known about a topic and what evidence already exists.
- Identifying a framework . When an appropriate framework is identified, the findings of a study may have broader significance and utility (Polit & Beck, 2021).
- Choosing a study design . The research design will determine exactly how the researcher will obtain the answers to the research question(s). The entire design needs to be structured and controlled, with the overarching goal of minimizing bias and errors. The design determines what data will be collected and how, how often data will be collected, what types of comparisons will be made. You can think of the study design as the architectural backbone of the entire study.
- Sampling . The researcher needs to determine a subset of the population that is to be studied. We will come back to the sampling concept in the next module. However, the goal of sampling is to choose a subset of the population that adequate reflects the population of interest.
- I nstruments to be used to collect data (with reliability and validity as a priority). Researchers must find a way to measure the research variables (intervention and outcome) accurately. The task of measuring is complex and challenging, as data needs to be collected reliably (measuring consistently each time) and valid. Reliability and validity are both about how well a method measures something. The next module will cover this in detail.
- Obtaining approval for ethical/legal human rights procedures . As we will learn in an upcoming module, there needs to be methods in place to safeguard human rights.
- Data collection . The fun part! Finally, after everything has been organized and planned, the researcher(s) begin to collect data. The pre-established plan (methodology) determines when data collection begins, how to accomplish it, how data collection staff will be trained, and how data will be recorded.
- Data analysis . Here comes the statistical analyses. The next module will dive into this.
- Discussion . After all the analyses have been complete, the researcher then needs to interpret the results and examine the implications. Researchers attempt to explain the findings in light of the theoretical framework, prior evidence, theory, clinical experience, and any limitations in the study now that it has been completed. Often, the researcher discusses not just the statistical significance, but also the clinical significance, as it is common to have one without the other.
- Summary/references . Part of the final steps of any research project is to disseminate (AKA: share) the findings. This may be in a published article, conference, poster session, etc. The point of this step is to communicate to others the information found through the study. All references are collected so that the researchers can give credit to others.
- Budget and funding . As a last mention in the overall steps, budget and funding for research is a consideration. Research can be expensive. Often, researchers can obtain a grant or other funding to help offset the costs.
Edit: Steps in Quantitative Research video. Step 12 should say “Dissemination” (sharing the results).
Experimental, Quasi-Experimental, and Non-Experimental Studies
To start this section, please watch this wonderful video by Jenny Barrow, MSN, RN, CNE, that explains experimental versus nonexperimental research.
(Jenny Barrow, 2019)
Now that you have that overview, continue reading this module.
Experimental Research : In experimental research, the researcher is seeking to draw a conclusion between an independent variable and a dependent variable. This design attempts to establish cause-effect relationships among the variables. You could think of experimental research as experimenting with “something” to see if it caused “something else”.
A true experiment is called a Randomized Controlled Trial (or RCT). An RCT is at the top of the echelon as far as quantitative experimental research. It’s the gold standard of scientific research. An RCT, a true experimental design, must have 3 features:
- An intervention : The experiment does something to the participants by the option of manipulating the independent variable.
- Control : Some participants in the study receive either the standard care, or no intervention at all. This is also called the counterfactual – meaning, it shows what would happen if no intervention was introduced.
- Randomization : Randomization happens when the researcher makes sure that it is completely random who receives the intervention and who receives the control. The purpose is to make the groups equal regarding all other factors except receipt of the intervention.
Note: There is a lot of confusion with students (and even some researchers!) when they refer to “ random assignment ” versus “ random sampling ”. Random assignment is a signature of a true experiment. This means that if participants are not truly randomly assigned to intervention groups, then it is not a true experiment. We will talk more about random sampling in the next module.
One very common method for RCT’s is called a pretest-posttest design . This is when the researcher measures the outcome before and after the intervention. For example, if the researcher had an IV (intervention/treatment) of a pain medication, the DV (pain) would be measured before the intervention is given and after it is given. The control group may just receive a placebo. This design permits the researcher to see if the change in pain was caused by the pain medication because only some people received it (Polit & Beck, 2021).
Another experimental design is called a crossover design . This type of design involves exposing participants to more than one treatment. For example, subject 1 first receives treatment A, then treatment B, then treatment C. Subject 2 might first receive treatment B, then treatment A, and then treatment C. In this type of study, the three conditions for an experiment are met: Intervention, randomization, and control – with the subjects serving as their own control group.
Control group conditions can be done in 4 ways:
- No intervention is used; control group gets no treatment at all
- “Usual care” or standard of care or normal procedures used
- An alternative intervention is uses (e.g. auditory versus visual stimulation)
- A placebo or pseudo-intervention, presumed to have no therapeutic value, is used
Quasi-Experimental Research : Quasi-experiments involve an experiment just like true experimental research. However, they lack randomization and some even lack a control group. Therefore, there is implementation and testing of an intervention, but there is an absence of randomization.
For example, perhaps we wanted to measure the effect of yoga for nursing students. The IV (intervention of yoga) is being offered to all nursing students and therefore randomization is not possible. For comparison, we could measure quality of life data on nursing students at a different university. Data is collected from both groups at baseline and then again after the yoga classes. Note, that in quasi-experiments, the phrase “comparison group” is sometimes used instead of “control group” against which outcome measures are collected.
Sometimes there is no comparison group either. This would be called a one-group pretest-posttest design .
Non-Experimental Research : Sometimes, cause-problem research questions cannot be answered with an experimental or quasi-experimental design because the IV cannot be manipulated. For example, if we want to measure what impact prerequisite grades have on student success in nursing programs, we obviously cannot manipulate the prerequisite grades. In another example, if we wanted to investigate how low birth weight impacts developmental progression in children, we cannot manipulate the birth weight. Often, you will see the word “observational” in lieu of non-experimental researcher. This does not mean the researcher is just standing and watching people, but instead it refers to the method of observing data that has already been established without manipulation.
There are various types of non-experimental research:
Correlational research : A correlational research design investigates relationships between two variables (or more) without the researcher controlling or manipulating any of them. In the example of prerequisites and nursing program success, that is a correlational design. Consider hypothetically, a researcher is studying a correlation between cancer and marriage. In this study, there are two variables: disease and marriage. Let us say marriage has a negative association with cancer. This means that married people are less likely to develop cancer.
Cohort design (also called a prospective design) : In a cohort study, the participants do not have the outcome of interest to begin with. They are selected based on the exposure status of the individual. They are then followed over time to evaluate for the occurrence of the outcome of interest. Cohorts may be divided into exposure categories once baseline measurements of a defined population are made. For example, the Framingham Cardiovascular Disease Study (CVD) used baseline measurements to divide the population into categories of CVD risk factors. Another example: An example of a cohort study is comparing the test scores of one group of people who underwent extensive tutoring and a special curriculum and those who did not receive any extra help. The group could be studied for years to assess whether their scores improve over time and at what rate.
Retrospective design : In retrospective studies, the outcome of interest has already occurred (or not occurred – e.g., in controls) in each individual by the time s/he is enrolled, and the data are collected either from records or by asking participants to recall exposures. There is no follow-up of participants. For example, a researcher might examine the medical histories of 1000 elderly women to identify the causes of health problems.
Case-control design : A study that compares two groups of people: those with the disease or condition under study (cases) and a very similar group of people who do not have the condition. For example, investigators conducted a case-control study to determine if there is an association between colon cancer and a high fat diet. Cases were all confirmed colon cancer cases in North Carolina in 2010. Controls were a sample of North Carolina residents without colon cancer.
Descriptive research : Descriptive research design is a type of research design that aims to obtain information to systematically describe a phenomenon, situation, or population. More specifically, it helps answer the what, when, where, and how questions regarding the research problem, rather than the why. For example, the researcher might wish to discover the percentage of motorists who tailgate – the prevalence of a certain behavior.
There are two other designs to mention, which are both on a time continuum basis.
Cross-sectional design : All data are collected at a single point in time. Retrospective studies are usually cross-sectional. The IV usually concerns events or behaviors occurring in the past. One cross-sectional study example in medicine is a data collection of smoking habits and lung cancer incidence in a given population. A cross-sectional study like this cannot solely determine that smoking habits cause lung cancer, but it can suggest a relationship that merits further investigation. Cross-sectional studies serve many purposes, and the cross-sectional design is the most relevant design when assessing the prevalence of disease, attitudes and knowledge among patients and health personnel, in validation studies comparing, for example, different measurement instruments, and in reliability studies.
Longitudinal design : Data are collected two or more times over an extended period. Longitudinal designs are better at showing patterns of change and at clarifying whether a cause occurred before an effect (outcome). A challenge in longitudinal studies is attrition or the loss of participants over time. In a longitudinal study subjects are followed over time with continuous or repeated monitoring of risk factors or health outcomes, or both. Such investigations vary enormously in their size and complexity. At one extreme a large population may be studied over decades. An example of a longitudinal design is a multiyear comparative study of the same children in an urban and a suburban school to record their cognitive development in depth.
Confounding and Extraneous Variables
Confounding variables are a type of extraneous variable that occur which interfere with or influence the relationship between the independent and dependent variables. In research that investigates a potential cause-and-effect relationship, a confounding variable is an unmeasured third variable that influences both the supposed cause and the supposed effect.
It’s important to consider potential confounding variables and account for them in research designs to ensure results are valid. You can imagine that if something sneaks in to influence the measured variables, it can really muck up the study!
Here is an example:
You collect data on sunburns and ice cream consumption. You find that higher ice cream consumption is associated with a higher probability of sunburn. Does that mean ice cream consumption causes sunburn?
Here, the confounding variable is temperature: hot temperatures cause people to both eat more ice cream and spend more time outdoors under the sun, resulting in more sunburns.

To ensure the internal validity of research, the researcher must account for confounding variables. If he/she fails to do so, the results may not reflect the actual relationship between the variables that they are interested in.
For instance, they may find a cause-and-effect relationship that does not actually exist, because the effect they measure is caused by the confounding variable (and not by the independent variable).
Here is another example:
The researcher finds that babies born to mothers who smoked during their pregnancies weigh significantly less than those born to non-smoking mothers. However, if the researcher does not account for the fact that smokers are more likely to engage in other unhealthy behaviors, such as drinking or eating less healthy foods, then he/she might overestimate the relationship between smoking and low birth weight.
Extraneous variables are any variables that the researcher is not investigating that can potentially affect the outcomes of the research study. If left uncontrolled, extraneous variables can lead to inaccurate conclusions about the relationship between IVs and DVs.
Extraneous variables can threaten the internal validity of a study by providing alternative explanations for the results. In an experiment, the researcher manipulates an independent variable to study its effects on a dependent variable.
In a study on mental performance, the researcher tests whether wearing a white lab coat, the independent variable (IV), improves scientific reasoning, the dependent variable (DV).
Students from a university are recruited to participate in the study. The researcher manipulates the independent variable by splitting participants into two groups:
- Participants in the experimental group are asked to wear a lab coat during the study.
- Participants in the control group are asked to wear a casual coat during the study.
All participants are given a scientific knowledge quiz, and their scores are compared between groups.
When extraneous variables are uncontrolled, it’s hard to determine the exact effects of the independent variable on the dependent variable, because the effects of extraneous variables may mask them.
Uncontrolled extraneous variables can also make it seem as though there is a true effect of the independent variable in an experiment when there’s actually none.
In the above experiment example, these extraneous variables can affect the science knowledge scores:
- Participant’s major (e.g., STEM or humanities)
- Participant’s interest in science
- Demographic variables such as gender or educational background
- Time of day of testing
- Experiment environment or setting
If these variables systematically differ between the groups, you can’t be sure whether your results come from your independent variable manipulation or from the extraneous variables.
In summary, an extraneous variable is anything that could influence the dependent variable. A confounding variable influences the dependent variable, and also correlates with or causally affects the independent variable.

Cause-and-Effect (Causality) Versus Association/Correlation
A very important concept to understand is cause-and-effect, also known as causality, versus correlation. Let’s look at these two concepts in very simplified statements. Causation means that one thing caused another thing to happen. Correlation means there is some association between the two thing we are measuring.
It would be nice if it were as simple as that. These two concepts can indeed by confused by many. Let’s dive deeper.
Two or more variables are considered to be related or associated, in a statistical context, if their values change so that as the value of one variable increases or decreases so does the value of the other variable (or the opposite direction).
For example, for the two variables of “hours worked” and “income earned”, there is a relationship between the two if the increase in hours is associated with an increase in income earned.
However, correlation is a statistical measure that describes the size and direction of a relationship between two or more variables. A correlation does not automatically mean that the change in one variable caused the change in value in the other variable.
Theoretically, the difference between the two types of relationships is easy to identify — an action or occurrence can cause another (e.g. smoking causes an increase in the risk of developing lung cancer), or it can correlate with another (e.g. smoking is correlated with alcoholism, but it does not cause alcoholism). In practice, however, it remains difficult to clearly establish cause and effect, compared with establishing correlation.
Simplified in this image, we can say that hot and sunny weather causes an increase in ice cream consumption. Similarly, we can demise that hot and sunny weather increases the incidence of sunburns. However, we cannot say that ice cream caused a sunburn (or that a sunburn increases consumption of ice cream). It is purely coincidental. In this example, it is pretty easy to anecdotally surmise correlation versus causation. However, in research, we have statistical tests that help researchers differentiate via specialized analyses.

Here is a great Khan Academy video of about 5 minutes that shows a worked example of correlation versus causation with regard to sledding accidents and frostbite cases:
https://www.khanacademy.org/test-prep/praxis-math/praxis-math-lessons/gtp–praxis-math–lessons–statistics-and-probability/v/gtp–praxis-math–video–correlation-and-causation
References & Attribution
“ Light bulb doodle ” by rawpixel licensed CC0 .
“ Magnifying glass ” by rawpixel licensed CC0
“ Orange flame ” by rawpixel licensed CC0 .
Jenny Barrow. (2019). Experimental versus nonexperimental research. https://www.youtube.com/watch?v=FJo8xyXHAlE
Leibold, N. (2020). Research variables. Measures and Concepts Commonly Encountered in EBP. Creative Commons License: BY NC
Polit, D. & Beck, C. (2021). Lippincott CoursePoint Enhanced for Polit’s Essentials of Nursing Research (10th ed.). Wolters Kluwer Health.
Evidence-Based Practice & Research Methodologies Copyright © by Tracy Fawns is licensed under a Creative Commons Attribution-NonCommercial-ShareAlike 4.0 International License , except where otherwise noted.
Share This Book
Have a language expert improve your writing
Run a free plagiarism check in 10 minutes, generate accurate citations for free.
- Knowledge Base
Methodology
- What Is Quantitative Research? | Definition, Uses & Methods
What Is Quantitative Research? | Definition, Uses & Methods
Published on June 12, 2020 by Pritha Bhandari . Revised on June 22, 2023.
Quantitative research is the process of collecting and analyzing numerical data. It can be used to find patterns and averages, make predictions, test causal relationships, and generalize results to wider populations.
Quantitative research is the opposite of qualitative research , which involves collecting and analyzing non-numerical data (e.g., text, video, or audio).
Quantitative research is widely used in the natural and social sciences: biology, chemistry, psychology, economics, sociology, marketing, etc.
- What is the demographic makeup of Singapore in 2020?
- How has the average temperature changed globally over the last century?
- Does environmental pollution affect the prevalence of honey bees?
- Does working from home increase productivity for people with long commutes?
Table of contents
Quantitative research methods, quantitative data analysis, advantages of quantitative research, disadvantages of quantitative research, other interesting articles, frequently asked questions about quantitative research.
You can use quantitative research methods for descriptive, correlational or experimental research.
- In descriptive research , you simply seek an overall summary of your study variables.
- In correlational research , you investigate relationships between your study variables.
- In experimental research , you systematically examine whether there is a cause-and-effect relationship between variables.
Correlational and experimental research can both be used to formally test hypotheses , or predictions, using statistics. The results may be generalized to broader populations based on the sampling method used.
To collect quantitative data, you will often need to use operational definitions that translate abstract concepts (e.g., mood) into observable and quantifiable measures (e.g., self-ratings of feelings and energy levels).
| Research method | How to use | Example |
|---|---|---|
| Control or manipulate an to measure its effect on a dependent variable. | To test whether an intervention can reduce procrastination in college students, you give equal-sized groups either a procrastination intervention or a comparable task. You compare self-ratings of procrastination behaviors between the groups after the intervention. | |
| Ask questions of a group of people in-person, over-the-phone or online. | You distribute with rating scales to first-year international college students to investigate their experiences of culture shock. | |
| (Systematic) observation | Identify a behavior or occurrence of interest and monitor it in its natural setting. | To study college classroom participation, you sit in on classes to observe them, counting and recording the prevalence of active and passive behaviors by students from different backgrounds. |
| Secondary research | Collect data that has been gathered for other purposes e.g., national surveys or historical records. | To assess whether attitudes towards climate change have changed since the 1980s, you collect relevant questionnaire data from widely available . |
Note that quantitative research is at risk for certain research biases , including information bias , omitted variable bias , sampling bias , or selection bias . Be sure that you’re aware of potential biases as you collect and analyze your data to prevent them from impacting your work too much.
Prevent plagiarism. Run a free check.
Once data is collected, you may need to process it before it can be analyzed. For example, survey and test data may need to be transformed from words to numbers. Then, you can use statistical analysis to answer your research questions .
Descriptive statistics will give you a summary of your data and include measures of averages and variability. You can also use graphs, scatter plots and frequency tables to visualize your data and check for any trends or outliers.
Using inferential statistics , you can make predictions or generalizations based on your data. You can test your hypothesis or use your sample data to estimate the population parameter .
First, you use descriptive statistics to get a summary of the data. You find the mean (average) and the mode (most frequent rating) of procrastination of the two groups, and plot the data to see if there are any outliers.
You can also assess the reliability and validity of your data collection methods to indicate how consistently and accurately your methods actually measured what you wanted them to.
Quantitative research is often used to standardize data collection and generalize findings . Strengths of this approach include:
- Replication
Repeating the study is possible because of standardized data collection protocols and tangible definitions of abstract concepts.
- Direct comparisons of results
The study can be reproduced in other cultural settings, times or with different groups of participants. Results can be compared statistically.
- Large samples
Data from large samples can be processed and analyzed using reliable and consistent procedures through quantitative data analysis.
- Hypothesis testing
Using formalized and established hypothesis testing procedures means that you have to carefully consider and report your research variables, predictions, data collection and testing methods before coming to a conclusion.
Despite the benefits of quantitative research, it is sometimes inadequate in explaining complex research topics. Its limitations include:
- Superficiality
Using precise and restrictive operational definitions may inadequately represent complex concepts. For example, the concept of mood may be represented with just a number in quantitative research, but explained with elaboration in qualitative research.
- Narrow focus
Predetermined variables and measurement procedures can mean that you ignore other relevant observations.
- Structural bias
Despite standardized procedures, structural biases can still affect quantitative research. Missing data , imprecise measurements or inappropriate sampling methods are biases that can lead to the wrong conclusions.
- Lack of context
Quantitative research often uses unnatural settings like laboratories or fails to consider historical and cultural contexts that may affect data collection and results.
Here's why students love Scribbr's proofreading services
Discover proofreading & editing
If you want to know more about statistics , methodology , or research bias , make sure to check out some of our other articles with explanations and examples.
- Chi square goodness of fit test
- Degrees of freedom
- Null hypothesis
- Discourse analysis
- Control groups
- Mixed methods research
- Non-probability sampling
- Inclusion and exclusion criteria
Research bias
- Rosenthal effect
- Implicit bias
- Cognitive bias
- Selection bias
- Negativity bias
- Status quo bias
Quantitative research deals with numbers and statistics, while qualitative research deals with words and meanings.
Quantitative methods allow you to systematically measure variables and test hypotheses . Qualitative methods allow you to explore concepts and experiences in more detail.
In mixed methods research , you use both qualitative and quantitative data collection and analysis methods to answer your research question .
Data collection is the systematic process by which observations or measurements are gathered in research. It is used in many different contexts by academics, governments, businesses, and other organizations.
Operationalization means turning abstract conceptual ideas into measurable observations.
For example, the concept of social anxiety isn’t directly observable, but it can be operationally defined in terms of self-rating scores, behavioral avoidance of crowded places, or physical anxiety symptoms in social situations.
Before collecting data , it’s important to consider how you will operationalize the variables that you want to measure.
Reliability and validity are both about how well a method measures something:
- Reliability refers to the consistency of a measure (whether the results can be reproduced under the same conditions).
- Validity refers to the accuracy of a measure (whether the results really do represent what they are supposed to measure).
If you are doing experimental research, you also have to consider the internal and external validity of your experiment.
Hypothesis testing is a formal procedure for investigating our ideas about the world using statistics. It is used by scientists to test specific predictions, called hypotheses , by calculating how likely it is that a pattern or relationship between variables could have arisen by chance.
Cite this Scribbr article
If you want to cite this source, you can copy and paste the citation or click the “Cite this Scribbr article” button to automatically add the citation to our free Citation Generator.
Bhandari, P. (2023, June 22). What Is Quantitative Research? | Definition, Uses & Methods. Scribbr. Retrieved September 4, 2024, from https://www.scribbr.com/methodology/quantitative-research/
Is this article helpful?

Pritha Bhandari
Other students also liked, descriptive statistics | definitions, types, examples, inferential statistics | an easy introduction & examples, get unlimited documents corrected.
✔ Free APA citation check included ✔ Unlimited document corrections ✔ Specialized in correcting academic texts
- Chapter Four: Quantitative Methods (Part 1)
Once you have chosen a topic to investigate, you need to decide which type of method is best to study it. This is one of the most important choices you will make on your research journey. Understanding the value of each of the methods described in this textbook to answer different questions allows you to be able to plan your own studies with more confidence, critique the studies others have done, and provide advice to your colleagues and friends on what type of research they should do to answer questions they have. After briefly reviewing quantitative research assumptions, this chapter is organized in three parts or sections. These parts can also be used as a checklist when working through the steps of your study. Specifically, part 1 focuses on planning a quantitative study (collecting data), part two explains the steps involved in doing a quantitative study, and part three discusses how to make sense of your results (organizing and analyzing data).
- Chapter One: Introduction
- Chapter Two: Understanding the distinctions among research methods
- Chapter Three: Ethical research, writing, and creative work
- Chapter Four: Quantitative Methods (Part 2 - Doing Your Study)
- Chapter Four: Quantitative Methods (Part 3 - Making Sense of Your Study)
- Chapter Five: Qualitative Methods (Part 1)
- Chapter Five: Qualitative Data (Part 2)
- Chapter Six: Critical / Rhetorical Methods (Part 1)
- Chapter Six: Critical / Rhetorical Methods (Part 2)
- Chapter Seven: Presenting Your Results
Quantitative Worldview Assumptions: A Review
In chapter 2, you were introduced to the unique assumptions quantitative research holds about knowledge and how it is created, or what the authors referred to in chapter one as "epistemology." Understanding these assumptions can help you better determine whether you need to use quantitative methods for a particular research study in which you are interested.
Quantitative researchers believe there is an objective reality, which can be measured. "Objective" here means that the researcher is not relying on their own perceptions of an event. S/he is attempting to gather "facts" which may be separate from people's feeling or perceptions about the facts. These facts are often conceptualized as "causes" and "effects." When you ask research questions or pose hypotheses with words in them such as "cause," "effect," "difference between," and "predicts," you are operating under assumptions consistent with quantitative methods. The overall goal of quantitative research is to develop generalizations that enable the researcher to better predict, explain, and understand some phenomenon.
Because of trying to prove cause-effect relationships that can be generalized to the population at large, the research process and related procedures are very important for quantitative methods. Research should be consistently and objectively conducted, without bias or error, in order to be considered to be valid (accurate) and reliable (consistent). Perhaps this emphasis on accurate and standardized methods is because the roots of quantitative research are in the natural and physical sciences, both of which have at their base the need to prove hypotheses and theories in order to better understand the world in which we live. When a person goes to a doctor and is prescribed some medicine to treat an illness, that person is glad such research has been done to know what the effects of taking this medicine is on others' bodies, so s/he can trust the doctor's judgment and take the medicines.
As covered in chapters 1 and 2, the questions you are asking should lead you to a certain research method choice. Students sometimes want to avoid doing quantitative research because of fear of math/statistics, but if their questions call for that type of research, they should forge ahead and use it anyway. If a student really wants to understand what the causes or effects are for a particular phenomenon, they need to do quantitative research. If a student is interested in what sorts of things might predict a person's behavior, they need to do quantitative research. If they want to confirm the finding of another researcher, most likely they will need to do quantitative research. If a student wishes to generalize beyond their participant sample to a larger population, they need to be conducting quantitative research.
So, ultimately, your choice of methods really depends on what your research goal is. What do you really want to find out? Do you want to compare two or more groups, look for relationships between certain variables, predict how someone will act or react, or confirm some findings from another study? If so, you want to use quantitative methods.
A topic such as self-esteem can be studied in many ways. Listed below are some example RQs about self-esteem. Which of the following research questions should be answered with quantitative methods?
- Is there a difference between men's and women's level of self- esteem?
- How do college-aged women describe their ups and downs with self-esteem?
- How has "self-esteem" been constructed in popular self-help books over time?
- Is there a relationship between self-esteem levels and communication apprehension?
What are the advantages of approaching a topic like self-esteem using quantitative methods? What are the disadvantages?
For more information, see the following website: Analyse This!!! Learning to analyse quantitative data
Answers: 1 & 4
Quantitative Methods Part One: Planning Your Study
Planning your study is one of the most important steps in the research process when doing quantitative research. As seen in the diagram below, it involves choosing a topic, writing research questions/hypotheses, and designing your study. Each of these topics will be covered in detail in this section of the chapter.
Topic Choice
Decide on topic.
How do you go about choosing a topic for a research project? One of the best ways to do this is to research something about which you would like to know more. Your communication professors will probably also want you to select something that is related to communication and things you are learning about in other communication classes.
When the authors of this textbook select research topics to study, they choose things that pique their interest for a variety of reasons, sometimes personal and sometimes because they see a need for more research in a particular area. For example, April Chatham-Carpenter studies adoption return trips to China because she has two adopted daughters from China and because there is very little research on this topic for Chinese adoptees and their families; she studied home vs. public schooling because her sister home schools, and at the time she started the study very few researchers had considered the social network implications for home schoolers (cf. http://www.uni.edu/chatham/homeschool.html ).
When you are asked in this class and other classes to select a topic to research, think about topics that you have wondered about, that affect you personally, or that know have gaps in the research. Then start writing down questions you would like to know about this topic. These questions will help you decide whether the goal of your study is to understand something better, explain causes and effects of something, gather the perspectives of others on a topic, or look at how language constructs a certain view of reality.
Review Previous Research
In quantitative research, you do not rely on your conclusions to emerge from the data you collect. Rather, you start out looking for certain things based on what the past research has found. This is consistent with what was called in chapter 2 as a deductive approach (Keyton, 2011), which also leads a quantitative researcher to develop a research question or research problem from reviewing a body of literature, with the previous research framing the study that is being done. So, reviewing previous research done on your topic is an important part of the planning of your study. As seen in chapter 3 and the Appendix, to do an adequate literature review, you need to identify portions of your topic that could have been researched in the past. To do that, you select key terms of concepts related to your topic.
Some people use concept maps to help them identify useful search terms for a literature review. For example, see the following website: Concept Mapping: How to Start Your Term Paper Research .
Narrow Topic to Researchable Area
Once you have selected your topic area and reviewed relevant literature related to your topic, you need to narrow your topic to something that can be researched practically and that will take the research on this topic further. You don't want your research topic to be so broad or large that you are unable to research it. Plus, you want to explain some phenomenon better than has been done before, adding to the literature and theory on a topic. You may want to test out what someone else has found, replicating their study, and therefore building to the body of knowledge already created.
To see how a literature review can be helpful in narrowing your topic, see the following sources. Narrowing or Broadening Your Research Topic and How to Conduct a Literature Review in Social Science
Research Questions & Hypotheses
Write Your Research Questions (RQs) and/or Hypotheses (Hs)
Once you have narrowed your topic based on what you learned from doing your review of literature, you need to formalize your topic area into one or more research questions or hypotheses. If the area you are researching is a relatively new area, and no existing literature or theory can lead you to predict what you might find, then you should write a research question. Take a topic related to social media, for example, which is a relatively new area of study. You might write a research question that asks:
"Is there a difference between how 1st year and 4th year college students use Facebook to communicate with their friends?"
If, however, you are testing out something you think you might find based on the findings of a large amount of previous literature or a well-developed theory, you can write a hypothesis. Researchers often distinguish between null and alternative hypotheses. The alternative hypothesis is what you are trying to test or prove is true, while the null hypothesis assumes that the alternative hypothesis is not true. For example, if the use of Facebook had been studied a great deal, and there were theories that had been developed on the use of it, then you might develop an alternative hypothesis, such as: "First-year students spend more time on using Facebook to communicate with their friends than fourth-year students do." Your null hypothesis, on the other hand, would be: "First-year students do not spend any more time using Facebook to communication with their friends than fourth-year students do." Researchers, however, only state the alternative hypothesis in their studies, and actually call it "hypothesis" rather than "alternative hypothesis."
Process of Writing a Research Question/Hypothesis.
Once you have decided to write a research question (RQ) or hypothesis (H) for your topic, you should go through the following steps to create your RQ or H.
Name the concepts from your overall research topic that you are interested in studying.
RQs and Hs have variables, or concepts that you are interested in studying. Variables can take on different values. For example, in the RQ above, there are at least two variables – year in college and use of Facebook (FB) to communicate. Both of them have a variety of levels within them.
When you look at the concepts you identified, are there any concepts which seem to be related to each other? For example, in our RQ, we are interested in knowing if there is a difference between first-year students and fourth-year students in their use of FB, meaning that we believe there is some connection between our two variables.
- Decide what type of a relationship you would like to study between the variables. Do you think one causes the other? Does a difference in one create a difference in the other? As the value of one changes, does the value of the other change?
Identify which one of these concepts is the independent (or predictor) variable, or the concept that is perceived to be the cause of change in the other variable? Which one is the dependent (criterion) variable, or the one that is affected by changes in the independent variable? In the above example RQ, year in school is the independent variable, and amount of time spent on Facebook communicating with friends is the dependent variable. The amount of time spent on Facebook depends on a person's year in school.
If you're still confused about independent and dependent variables, check out the following site: Independent & Dependent Variables .
Express the relationship between the concepts as a single sentence – in either a hypothesis or a research question.
For example, "is there a difference between international and American students on their perceptions of the basic communication course," where cultural background and perceptions of the course are your two variables. Cultural background would be the independent variable, and perceptions of the course would be your dependent variable. More examples of RQs and Hs are provided in the next section.
APPLICATION: Try the above steps with your topic now. Check with your instructor to see if s/he would like you to send your topic and RQ/H to him/her via e-mail.
Types of Research Questions/Hypotheses
Once you have written your RQ/H, you need to determine what type of research question or hypothesis it is. This will help you later decide what types of statistics you will need to run to answer your question or test your hypothesis. There are three possible types of questions you might ask, and two possible types of hypotheses. The first type of question cannot be written as a hypothesis, but the second and third types can.
Descriptive Question.
The first type of question is a descriptive question. If you have only one variable or concept you are studying, OR if you are not interested in how the variables you are studying are connected or related to each other, then your question is most likely a descriptive question.
This type of question is the closest to looking like a qualitative question, and often starts with a "what" or "how" or "why" or "to what extent" type of wording. What makes it different from a qualitative research question is that the question will be answered using numbers rather than qualitative analysis. Some examples of a descriptive question, using the topic of social media, include the following.
"To what extent are college-aged students using Facebook to communicate with their friends?"
"Why do college-aged students use Facebook to communicate with their friends?"
Notice that neither of these questions has a clear independent or dependent variable, as there is no clear cause or effect being assumed by the question. The question is merely descriptive in nature. It can be answered by summarizing the numbers obtained for each category, such as by providing percentages, averages, or just the raw totals for each type of strategy or organization. This is true also of the following research questions found in a study of online public relations strategies:
"What online public relations strategies are organizations implementing to combat phishing" (Baker, Baker, & Tedesco, 2007, p. 330), and
"Which organizations are doing most and least, according to recommendations from anti- phishing advocacy recommendations, to combat phishing" (Baker, Baker, & Tedesco, 2007, p. 330)
The researchers in this study reported statistics in their results or findings section, making it clearly a quantitative study, but without an independent or dependent variable; therefore, these research questions illustrate the first type of RQ, the descriptive question.
Difference Question/Hypothesis.
The second type of question is a question/hypothesis of difference, and will often have the word "difference" as part of the question. The very first research question in this section, asking if there is a difference between 1st year and 4th year college students' use of Facebook, is an example of this type of question. In this type of question, the independent variable is some type of grouping or categories, such as age. Another example of a question of difference is one April asked in her research on home schooling: "Is there a difference between home vs. public schoolers on the size of their social networks?" In this example, the independent variable is home vs. public schooling (a group being compared), and the dependent variable is size of social networks. Hypotheses can also be difference hypotheses, as the following example on the same topic illustrates: "Public schoolers have a larger social network than home schoolers do."
Relationship/Association Question/Hypothesis.
The third type of question is a relationship/association question or hypothesis, and will often have the word "relate" or "relationship" in it, as the following example does: "There is a relationship between number of television ads for a political candidate and how successful that political candidate is in getting elected." Here the independent (or predictor) variable is number of TV ads, and the dependent (or criterion) variable is the success at getting elected. In this type of question, there is no grouping being compared, but rather the independent variable is continuous (ranges from zero to a certain number) in nature. This type of question can be worded as either a hypothesis or as a research question, as stated earlier.
Test out your knowledge of the above information, by answering the following questions about the RQ/H listed below. (Remember, for a descriptive question there are no clear independent & dependent variables.)
- What is the independent variable (IV)?
- What is the dependent variable (DV)?
- What type of research question/hypothesis is it? (descriptive, difference, relationship/association)
- "Is there a difference on relational satisfaction between those who met their current partner through online dating and those who met their current partner face-to-face?"
- "How do Fortune 500 firms use focus groups to market new products?"
- "There is a relationship between age and amount of time spent online using social media."
Answers: RQ1 is a difference question, with type of dating being the IV and relational satisfaction being the DV. RQ2 is a descriptive question with no IV or DV. RQ3 is a relationship hypothesis with age as the IV and amount of time spent online as the DV.
Design Your Study
The third step in planning your research project, after you have decided on your topic/goal and written your research questions/hypotheses, is to design your study which means to decide how to proceed in gathering data to answer your research question or to test your hypothesis. This step includes six things to do. [NOTE: The terms used in this section will be defined as they are used.]
- Decide type of study design: Experimental, quasi-experimental, non-experimental.
- Decide kind of data to collect: Survey/interview, observation, already existing data.
- Operationalize variables into measurable concepts.
- Determine type of sample: Probability or non-probability.
- Decide how you will collect your data: face-to-face, via e-mail, an online survey, library research, etc.
- Pilot test your methods.
Types of Study Designs
With quantitative research being rooted in the scientific method, traditional research is structured in an experimental fashion. This is especially true in the natural sciences, where they try to prove causes and effects on topics such as successful treatments for cancer. For example, the University of Iowa Hospitals and Clinics regularly conduct clinical trials to test for the effectiveness of certain treatments for medical conditions ( University of Iowa Hospitals & Clinics: Clinical Trials ). They use human participants to conduct such research, regularly recruiting volunteers. However, in communication, true experiments with treatments the researcher controls are less necessary and thus less common. It is important for the researcher to understand which type of study s/he wishes to do, in order to accurately communicate his/her methods to the public when describing the study.
There are three possible types of studies you may choose to do, when embarking on quantitative research: (a) True experiments, (b) quasi-experiments, and (c) non-experiments.
For more information to read on these types of designs, take a look at the following website and related links in it: Types of Designs .
The following flowchart should help you distinguish between the three types of study designs described below.
True Experiments.
The first two types of study designs use difference questions/hypotheses, as the independent variable for true and quasi-experiments is nominal or categorical (based on categories or groupings), as you have groups that are being compared. As seen in the flowchart above, what distinguishes a true experiment from the other two designs is a concept called "random assignment." Random assignment means that the researcher controls to which group the participants are assigned. April's study of home vs. public schooling was NOT a true experiment, because she could not control which participants were home schooled and which ones were public schooled, and instead relied on already existing groups.
An example of a true experiment reported in a communication journal is a study investigating the effects of using interest-based contemporary examples in a lecture on the history of public relations, in which the researchers had the following two hypotheses: "Lectures utilizing interest- based examples should result in more interested participants" and "Lectures utilizing interest- based examples should result in participants with higher scores on subsequent tests of cognitive recall" (Weber, Corrigan, Fornash, & Neupauer, 2003, p. 118). In this study, the 122 college student participants were randomly assigned by the researchers to one of two lecture video viewing groups: a video lecture with traditional examples and a video with contemporary examples. (To see the results of the study, look it up using your school's library databases).
A second example of a true experiment in communication is a study of the effects of viewing either a dramatic narrative television show vs. a nonnarrative television show about the consequences of an unexpected teen pregnancy. The researchers randomly assigned their 367 undergraduate participants to view one of the two types of shows.
Moyer-Gusé, E., & Nabi, R. L. (2010). Explaining the effects of narrative in an entertainment television program: Overcoming resistance to persuasion. Human Communication Research, 36 , 26-52.
A third example of a true experiment done in the field of communication can be found in the following study.
Jensen, J. D. (2008). Scientific uncertainty in news coverage of cancer research: Effects of hedging on scientists' and journalists' credibility. Human Communication Research, 34, 347-369.
In this study, Jakob Jensen had three independent variables. He randomly assigned his 601 participants to 1 of 20 possible conditions, between his three independent variables, which were (a) a hedged vs. not hedged message, (b) the source of the hedging message (research attributed to primary vs. unaffiliated scientists), and (c) specific news story employed (of which he had five randomly selected news stories about cancer research to choose from). Although this study was pretty complex, it does illustrate the true experiment in our field since the participants were randomly assigned to read a particular news story, with certain characteristics.
Quasi-Experiments.
If the researcher is not able to randomly assign participants to one of the treatment groups (or independent variable), but the participants already belong to one of them (e.g., age; home vs. public schooling), then the design is called a quasi-experiment. Here you still have an independent variable with groups, but the participants already belong to a group before the study starts, and the researcher has no control over which group they belong to.
An example of a hypothesis found in a communication study is the following: "Individuals high in trait aggression will enjoy violent content more than nonviolent content, whereas those low in trait aggression will enjoy violent content less than nonviolent content" (Weaver & Wilson, 2009, p. 448). In this study, the researchers could not assign the participants to a high or low trait aggression group since this is a personality characteristic, so this is a quasi-experiment. It does not have any random assignment of participants to the independent variable groups. Read their study, if you would like to, at the following location.
Weaver, A. J., & Wilson, B. J. (2009). The role of graphic and sanitized violence in the enjoyment of television dramas. Human Communication Research, 35 (3), 442-463.
Benoit and Hansen (2004) did not choose to randomly assign participants to groups either, in their study of a national presidential election survey, in which they were looking at differences between debate and non-debate viewers, in terms of several dependent variables, such as which candidate viewers supported. If you are interested in discovering the results of this study, take a look at the following article.
Benoit, W. L., & Hansen, G. J. (2004). Presidential debate watching, issue knowledge, character evaluation, and vote choice. Human Communication Research, 30 (1), 121-144.
Non-Experiments.
The third type of design is the non-experiment. Non-experiments are sometimes called survey designs, because their primary way of collecting data is through surveys. This is not enough to distinguish them from true experiments and quasi-experiments, however, as both of those types of designs may use surveys as well.
What makes a study a non-experiment is that the independent variable is not a grouping or categorical variable. Researchers observe or survey participants in order to describe them as they naturally exist without any experimental intervention. Researchers do not give treatments or observe the effects of a potential natural grouping variable such as age. Descriptive and relationship/association questions are most often used in non-experiments.
Some examples of this type of commonly used design for communication researchers include the following studies.
- Serota, Levine, and Boster (2010) used a national survey of 1,000 adults to determine the prevalence of lying in America (see Human Communication Research, 36 , pp. 2-25).
- Nabi (2009) surveyed 170 young adults on their perceptions of reality television on cosmetic surgery effects, looking at several things: for example, does viewing cosmetic surgery makeover programs relate to body satisfaction (p. 6), finding no significant relationship between those two variables (see Human Communication Research, 35 , pp. 1-27).
- Derlega, Winstead, Mathews, and Braitman (2008) collected stories from 238 college students on reasons why they would disclose or not disclose personal information within close relationships (see Communication Research Reports, 25 , pp. 115-130). They coded the participants' answers into categories so they could count how often specific reasons were mentioned, using a method called content analysis , to answer the following research questions:
RQ1: What are research participants' attributions for the disclosure and nondisclosure of highly personal information?
RQ2: Do attributions reflect concerns about rewards and costs of disclosure or the tension between openness with another and privacy?
RQ3: How often are particular attributions for disclosure/nondisclosure used in various types of relationships? (p. 117)
All of these non-experimental studies have in common no researcher manipulation of an independent variable or even having an independent variable that has natural groups that are being compared.
Identify which design discussed above should be used for each of the following research questions.
- Is there a difference between generations on how much they use MySpace?
- Is there a relationship between age when a person first started using Facebook and the amount of time they currently spend on Facebook daily?
- Is there a difference between potential customers' perceptions of an organization who are shown an organization's Facebook page and those who are not shown an organization's Facebook page?
[HINT: Try to identify the independent and dependent variable in each question above first, before determining what type of design you would use. Also, try to determine what type of question it is – descriptive, difference, or relationship/association.]
Answers: 1. Quasi-experiment 2. Non-experiment 3. True Experiment
Data Collection Methods
Once you decide the type of quantitative research design you will be using, you will need to determine which of the following types of data you will collect: (a) survey data, (b) observational data, and/or (c) already existing data, as in library research.
Using the survey data collection method means you will talk to people or survey them about their behaviors, attitudes, perceptions, and demographic characteristics (e.g., biological sex, socio-economic status, race). This type of data usually consists of a series of questions related to the concepts you want to study (i.e., your independent and dependent variables). Both of April's studies on home schooling and on taking adopted children on a return trip back to China used survey data.
On a survey, you can have both closed-ended and open-ended questions. Closed-ended questions, can be written in a variety of forms. Some of the most common response options include the following.
Likert responses – for example: for the following statement, ______ do you strongly agree agree neutral disagree strongly disagree
Semantic differential – for example: does the following ______ make you Happy ..................................... Sad
Yes-no answers for example: I use social media daily. Yes / No.
One site to check out for possible response options is http://www.360degreefeedback.net/media/ResponseScales.pdf .
Researchers often follow up some of their closed-ended questions with an "other" category, in which they ask their participants to "please specify," their response if none of the ones provided are applicable. They may also ask open-ended questions on "why" a participant chose a particular answer or ask participants for more information about a particular topic. If the researcher wants to use the open-ended question responses as part of his/her quantitative study, the answers are usually coded into categories and counted, in terms of the frequency of a certain answer, using a method called content analysis , which will be discussed when we talk about already-existing artifacts as a source of data.
Surveys can be done face-to-face, by telephone, mail, or online. Each of these methods has its own advantages and disadvantages, primarily in the form of the cost in time and money to do the survey. For example, if you want to survey many people, then online survey tools such as surveygizmo.com and surveymonkey.com are very efficient, but not everyone has access to taking a survey on the computer, so you may not get an adequate sample of the population by doing so. Plus you have to decide how you will recruit people to take your online survey, which can be challenging. There are trade-offs with every method.
For more information on things to consider when selecting your survey method, check out the following website:
Selecting the Survey Method .
There are also many good sources for developing a good survey, such as the following websites. Constructing the Survey Survey Methods Designing Surveys
Observation.
A second type of data collection method is observation . In this data collection method, you make observations of the phenomenon you are studying and then code your observations, so that you can count what you are studying. This type of data collection method is often called interaction analysis, if you collect data by observing people's behavior. For example, if you want to study the phenomenon of mall-walking, you could go to a mall and count characteristics of mall-walkers. A researcher in the area of health communication could study the occurrence of humor in an operating room, for example, by coding and counting the use of humor in such a setting.
One extended research study using observational data collection methods, which is cited often in interpersonal communication classes, is John Gottman's research, which started out in what is now called "The Love Lab." In this lab, researchers observe interactions between couples, including physiological symptoms, using coders who look for certain items found to predict relationship problems and success.
Take a look at the YouTube video about "The Love Lab" at the following site to learn more about the potential of using observation in collecting data for a research study: The "Love" Lab .
Already-Existing Artifacts.
The third method of quantitative data collection is the use of already-existing artifacts . With this method, you choose certain artifacts (e.g., newspaper or magazine articles; television programs; webpages) and code their content, resulting in a count of whatever you are studying. With this data collection method, researchers most often use what is called quantitative content analysis . Basically, the researcher counts frequencies of something that occurs in an artifact of study, such as the frequency of times something is mentioned on a webpage. Content analysis can also be used in qualitative research, where a researcher identifies and creates text-based themes but does not do a count of the occurrences of these themes. Content analysis can also be used to take open-ended questions from a survey method, and identify countable themes within the questions.
Content analysis is a very common method used in media studies, given researchers are interested in studying already-existing media artifacts. There are many good sources to illustrate how to do content analysis such as are seen in the box below.
See the following sources for more information on content analysis. Writing Guide: Content Analysis A Flowchart for the Typical Process of Content Analysis Research What is Content Analysis?
With content analysis and any method that you use to code something into categories, one key concept you need to remember is inter-coder or inter-rater reliability , in which there are multiple coders (at least two) trained to code the observations into categories. This check on coding is important because you need to check to make sure that the way you are coding your observations on the open-ended answers is the same way that others would code a particular item. To establish this kind of inter-coder or inter-rater reliability, researchers prepare codebooks (to train their coders on how to code the materials) and coding forms for their coders to use.
To see some examples of actual codebooks used in research, see the following website: Human Coding--Sample Materials .
There are also online inter-coder reliability calculators some researchers use, such as the following: ReCal: reliability calculation for the masses .
Regardless of which method of data collection you choose, you need to decide even more specifically how you will measure the variables in your study, which leads us to the next planning step in the design of a study.
Operationalization of Variables into Measurable Concepts
When you look at your research question/s and/or hypotheses, you should know already what your independent and dependent variables are. Both of these need to be measured in some way. We call that way of measuring operationalizing a variable. One way to think of it is writing a step by step recipe for how you plan to obtain data on this topic. How you choose to operationalize your variable (or write the recipe) is one all-important decision you have to make, which will make or break your study. In quantitative research, you have to measure your variables in a valid (accurate) and reliable (consistent) manner, which we discuss in this section. You also need to determine the level of measurement you will use for your variables, which will help you later decide what statistical tests you need to run to answer your research question/s or test your hypotheses. We will start with the last topic first.
Level of Measurement
Level of measurement has to do with whether you measure your variables using categories or groupings OR whether you measure your variables using a continuous level of measurement (range of numbers). The level of measurement that is considered to be categorical in nature is called nominal, while the levels of measurement considered to be continuous in nature are ordinal, interval, and ratio. The only ones you really need to know are nominal, ordinal, and interval/ratio.
Nominal variables are categories that do not have meaningful numbers attached to them but are broader categories, such as male and female, home schooled and public schooled, Caucasian and African-American. Ordinal variables do have numbers attached to them, in that the numbers are in a certain order, but there are not equal intervals between the numbers (e.g., such as when you rank a group of 5 items from most to least preferred, where 3 might be highly preferred, and 2 hated). Interval/ratio variables have equal intervals between the numbers (e.g., weight, age).
For more information about these levels of measurement, check out one of the following websites. Levels of Measurement Measurement Scales in Social Science Research What is the difference between ordinal, interval and ratio variables? Why should I care?
Validity and Reliability
When developing a scale/measure or survey, you need to be concerned about validity and reliability. Readers of quantitative research expect to see researchers justify their research measures using these two terms in the methods section of an article or paper.
Validity. Validity is the extent to which your scale/measure or survey adequately reflects the full meaning of the concept you are measuring. Does it measure what you say it measures? For example, if researchers wanted to develop a scale to measure "servant leadership," the researchers would have to determine what dimensions of servant leadership they wanted to measure, and then create items which would be valid or accurate measures of these dimensions. If they included items related to a different type of leadership, those items would not be a valid measure of servant leadership. When doing so, the researchers are trying to prove their measure has internal validity. Researchers may also be interested in external validity, but that has to do with how generalizable their study is to a larger population (a topic related to sampling, which we will consider in the next section), and has less to do with the validity of the instrument itself.
There are several types of validity you may read about, including face validity, content validity, criterion-related validity, and construct validity. To learn more about these types of validity, read the information at the following link: Validity .
To improve the validity of an instrument, researchers need to fully understand the concept they are trying to measure. This means they know the academic literature surrounding that concept well and write several survey questions on each dimension measured, to make sure the full idea of the concept is being measured. For example, Page and Wong (n.d.) identified four dimensions of servant leadership: character, people-orientation, task-orientation, and process-orientation ( A Conceptual Framework for Measuring Servant-Leadership ). All of these dimensions (and any others identified by other researchers) would need multiple survey items developed if a researcher wanted to create a new scale on servant leadership.
Before you create a new survey, it can be useful to see if one already exists with established validity and reliability. Such measures can be found by seeing what other respected studies have used to measure a concept and then doing a library search to find the scale/measure itself (sometimes found in the reference area of a library in books like those listed below).
Reliability . Reliability is the second criterion you will need to address if you choose to develop your own scale or measure. Reliability is concerned with whether a measurement is consistent and reproducible. If you have ever wondered why, when taking a survey, that a question is asked more than once or very similar questions are asked multiple times, it is because the researchers one concerned with proving their study has reliability. Are you, for example, answering all of the similar questions similarly? If so, the measure/scale may have good reliability or consistency over time.
Researchers can use a variety of ways to show their measure/scale is reliable. See the following websites for explanations of some of these ways, which include methods such as the test-retest method, the split-half method, and inter-coder/rater reliability. Types of Reliability Reliability
To understand the relationship between validity and reliability, a nice visual provided below is explained at the following website (Trochim, 2006, para. 2). Reliability & Validity
Self-Quiz/Discussion:
Take a look at one of the surveys found at the following poll reporting sites on a topic which interests you. Critique one of these surveys, using what you have learned about creating surveys so far.
http://www.pewinternet.org/ http://pewresearch.org/ http://www.gallup.com/Home.aspx http://www.kff.org/
One of the things you might have critiqued in the previous self-quiz/discussion may have had less to do with the actual survey itself, but rather with how the researchers got their participants or sample. How participants are recruited is just as important to doing a good study as how valid and reliable a survey is.
Imagine that in the article you chose for the last "self-quiz/discussion" you read the following quote from the Pew Research Center's Internet and American Life Project: "One in three teens sends more than 100 text messages a day, or 3000 texts a month" (Lenhart, 2010, para.5). How would you know whether you could trust this finding to be true? Would you compare it to what you know about texting from your own and your friends' experiences? Would you want to know what types of questions people were asked to determine this statistic, or whether the survey the statistic is based on is valid and reliable? Would you want to know what type of people were surveyed for the study? As a critical consumer of research, you should ask all of these types of questions, rather than just accepting such a statement as undisputable fact. For example, if only people shopping at an Apple Store were surveyed, the results might be skewed high.
In particular, related to the topic of this section, you should ask about the sampling method the researchers did. Often, the researchers will provide information related to the sample, stating how many participants were surveyed (in this case 800 teens, aged 12-17, who were a nationally representative sample of the population) and how much the "margin of error" is (in this case +/- 3.8%). Why do they state such things? It is because they know the importance of a sample in making the case for their findings being legitimate and credible. Margin of error is how much we are confident that our findings represent the population at large. The larger the margin of error, the less likely it is that the poll or survey is accurate. Margin of error assumes a 95% confidence level that what we found from our study represents the population at large.
For more information on margin of error, see one of the following websites. Answers.com Margin of Error Stats.org Margin of Error Americanresearchgroup.com Margin of Error [this last site is a margin of error calculator, which shows that margin of error is directly tied to the size of your sample, in relationship to the size of the population, two concepts we will talk about in the next few paragraphs]
In particular, this section focused on sampling will talk about the following topics: (a) the difference between a population vs. a sample; (b) concepts of error and bias, or "it's all about significance"; (c) probability vs. non-probability sampling; and (d) sample size issues.
Population vs. Sample
When doing quantitative studies, such as the study of cell phone usage among teens, you are never able to survey the entire population of teenagers, so you survey a portion of the population. If you study every member of a population, then you are conducting a census such as the United States Government does every 10 years. When, however, this is not possible (because you do not have the money the U.S. government has!), you attempt to get as good a sample as possible.
Characteristics of a population are summarized in numerical form, and technically these numbers are called parameters . However, numbers which summarize the characteristics of a sample are called statistics .
Error and Bias
If a sample is not done well, then you may not have confidence in how the study's results can be generalized to the population from which the sample was taken. Your confidence level is often stated as the margin of error of the survey. As noted earlier, a study's margin of error refers to the degree to which a sample differs from the total population you are studying. In the Pew survey, they had a margin of error of +/- 3.8%. So, for example, when the Pew survey said 33% of teens send more than 100 texts a day, the margin of error means they were 95% sure that 29.2% - 36.8% of teens send this many texts a day.
Margin of error is tied to sampling error , which is how much difference there is between your sample's results and what would have been obtained if you had surveyed the whole population. Sample error is linked to a very important concept for quantitative researchers, which is the notion of significance . Here, significance does not refer to whether some finding is morally or practically significant, it refers to whether a finding is statistically significant, meaning the findings are not due to chance but actually represent something that is found in the population. Statistical significance is about how much you, as the researcher, are willing to risk saying you found something important and be wrong.
For the difference between statistical significance and practical significance, see the following YouTube video: Statistical and Practical Significance .
Scientists set certain arbitrary standards based on the probability they could be wrong in reporting their findings. These are called significance levels and are commonly reported in the literature as p <.05 or p <.01 or some other probability (or p ) level.
If an article says a statistical test reported that p < .05 , it simply means that they are most likely correct in what they are saying, but there is a 5% chance they could be wrong and not find the same results in the population. If p < .01, then there would be only a 1% chance they were wrong and would not find the same results in the population. The lower the probability level, the more certain the results.
When researchers are wrong, or make that kind of decision error, it often implies that either (a) their sample was biased and was not representative of the true population in some way, or (b) that something they did in collecting the data biased the results. There are actually two kinds of sampling error talked about in quantitative research: Type I and Type II error. Type 1 error is what happens when you think you found something statistically significant and claim there is a significant difference or relationship, when there really is not in the actual population. So there is something about your sample that made you find something that is not in the actual population. (Type I error is the same as the probability level, or .05, if using the traditional p-level accepted by most researchers.) Type II error happens when you don't find a statistically significant difference or relationship, yet there actually is one in the population at large, so once again, your sample is not representative of the population.
For more information on these two types of error, check out the following websites. Hypothesis Testing: Type I Error, Type II Error Type I and Type II Errors - Making Mistakes in the Justice System
Researchers want to select a sample that is representative of the population in order to reduce the likelihood of having a sample that is biased. There are two types of bias particularly troublesome for researchers, in terms of sampling error. The first type is selection bias , in which each person in the population does not have an equal chance to be chosen for the sample, which happens frequently in communication studies, because we often rely on convenience samples (whoever we can get to complete our surveys). The second type of bias is response bias , in which those who volunteer for a study have different characteristics than those who did not volunteer for the study, another common challenge for communication researchers. Volunteers for a study may very well be different from persons who choose not to volunteer for a study, so that you have a biased sample by relying just on volunteers, which is not representative of the population from which you are trying to sample.
Probability vs. Non-Probability Sampling
One of the best ways to lower your sampling error and reduce the possibility of bias is to do probability or random sampling. This means that every person in the population has an equal chance of being selected to be in your sample. Another way of looking at this is to attempt to get a representative sample, so that the characteristics of your sample closely approximate those of the population. A sample needs to contain essentially the same variations that exist in the population, if possible, especially on the variables or elements that are most important to you (e.g., age, biological sex, race, level of education, socio-economic class).
There are many different ways to draw a probability/random sample from the population. Some of the most common are a simple random sample , where you use a random numbers table or random number generator to select your sample from the population.
There are several examples of random number generators available online. See the following example of an online random number generator: http://www.randomizer.org/ .
A systematic random sample takes every n-th number from the population, depending on how many people you would like to have in your sample. A stratified random sample does random sampling within groups, and a multi-stage or cluster sample is used when there are multiple groups within a large area and a large population, and the researcher does random sampling in stages.
If you are interested in understanding more about these types of probability/random samples, take a look at the following website: Probability Sampling .
However, many times communication researchers use whoever they can find to participate in their study, such as college students in their classes since these people are easily accessible. Many of the studies in interpersonal communication and relationship development, for example, used this type of sample. This is called a convenience sample. In doing so, they are using a non- probability or non-random sample. In these types of samples, each member of the population does not have an equal opportunity to be selected. For example, if you decide to ask your facebook friends to participate in an online survey you created about how college students in the U.S. use cell phones to text, you are using a non-random type of sample. You are unable to randomly sample the whole population in the U.S. of college students who text, so you attempt to find participants more conveniently. Some common non-random or non-probability samples are:
- accidental/convenience samples, such as the facebook example illustrates
- quota samples, in which you do convenience samples within subgroups of the population, such as biological sex, looking for a certain number of participants in each group being compared
- snowball or network sampling, where you ask current participants to send your survey onto their friends.
For more information on non-probability sampling, see the following website: Nonprobability Sampling .
Researchers, such as communication scholars, often use these types of samples because of the nature of their research. Most research designs used in communication are not true experiments, such as would be required in the medical field where they are trying to prove some cause-effect relationship to cure or alleviate symptoms of a disease. Most communication scholars recognize that human behavior in communication situations is much less predictable, so they do not adhere to the strictest possible worldview related to quantitative methods and are less concerned with having to use probability sampling.
They do recognize, however, that with either probability or non-probability sampling, there is still the possibility of bias and error, although much less with probability sampling. That is why all quantitative researchers, regardless of field, will report statistical significance levels if they are interested in generalizing from their sample to the population at large, to let the readers of their work know how confident they are in their results.
Size of Sample
The larger the sample, the more likely the sample is going to be representative of the population. If there is a lot of variability in the population (e.g., lots of different ethnic groups in the population), a researcher will need a larger sample. If you are interested in detecting small possible differences (e.g., in a close political race), you need a larger sample. However, the bigger your population, the less you have to increase the size of your sample in order to have an adequate sample, as is illustrated by an example sample size calculator such as can be found at http://www.raosoft.com/samplesize.html .
Using the example sample size calculator, see how you might determine how large of a sample you might need in order to study how college students in the U.S. use texting on their cell phones. You would have to first determine approximately how many college students are in the U.S. According to ANEKI, there are a little over 14,000,000 college students in the U.S. ( Countries with the Most University Students ). When inputting that figure into the sample size calculator below (using no commas for the population size), you would need a sample size of approximately 385 students. If the population size was 20,000, you would need a sample of 377 students. If the population was only 2,000, you would need a sample of 323. For a population of 500, you would need a sample of 218.
It is not enough, however, to just have an adequate or large sample. If there is bias in the sampling, you can have a very bad large sample, one that also does not represent the population at large. So, having an unbiased sample is even more important than having a large sample.
So, what do you do, if you cannot reasonably conduct a probability or random sample? You run statistics which report significance levels, and you report the limitations of your sample in the discussion section of your paper/article.
Pilot Testing Methods
Now that we have talked about the different elements of your study design, you should try out your methods by doing a pilot test of some kind. This means that you try out your procedures with someone to try to catch any mistakes in your design before you start collecting data from actual participants in your study. This will save you time and money in the long run, along with unneeded angst over mistakes you made in your design during data collection. There are several ways you might do this.
You might ask an expert who knows about this topic (such as a faculty member) to try out your experiment or survey and provide feedback on what they think of your design. You might ask some participants who are like your potential sample to take your survey or be a part of your pilot test; then you could ask them which parts were confusing or needed revising. You might have potential participants explain to you what they think your questions mean, to see if they are interpreting them like you intended, or if you need to make some questions clearer.
The main thing is that you do not just assume your methods will work or are the best type of methods to use until you try them out with someone. As you write up your study, in your methods section of your paper, you can then talk about what you did to change your study based on the pilot study you did.
Institutional Review Board (IRB) Approval
The last step of your planning takes place when you take the necessary steps to get your study approved by your institution's review board. As you read in chapter 3, this step is important if you are planning on using the data or results from your study beyond just the requirements for your class project. See chapter 3 for more information on the procedures involved in this step.
Conclusion: Study Design Planning
Once you have decided what topic you want to study, you plan your study. Part 1 of this chapter has covered the following steps you need to follow in this planning process:
- decide what type of study you will do (i.e., experimental, quasi-experimental, non- experimental);
- decide on what data collection method you will use (i.e., survey, observation, or already existing data);
- operationalize your variables into measureable concepts;
- determine what type of sample you will use (probability or non-probability);
- pilot test your methods; and
- get IRB approval.
At that point, you are ready to commence collecting your data, which is the topic of the next section in this chapter.
|
|

IMAGES
VIDEO
COMMENTS
ading this chapter, you will be able to do th. following:Define basic terms. or quantitative research.Describe the research. rcle.Identify the four major. als of social research.Write a checklist of the W's.Understan. the reasons for both reporting and interpreting numbers.State the importan. specifying the direction and magnitude of a ...
quantitative research process. Involves conceptualizing a research project, planning and implementing that project, and communicating the findings. quasi-experimental research. Examines causal relationships or determines the effect of one variable on another. reading a research report.
Chapter 2: Introduction to Quantitative Research. Quantitative Research Is a formal, objective, rigorous, and systematic process for generating numerical information about the world Conducted to describe new situations, events, or concepts, examine relationships among variables, and determine the effectiveness of interventions on a selected health outcomes o Examples: o Describing the spread ...
Chapter 2- Introduction to Quantitative Research - Free download as PDF File (.pdf), Text File (.txt) or read online for free. This document provides an introduction to quantitative research. It defines key terms, compares problem-solving and research processes, and outlines the steps in quantitative research including descriptive, correlational, quasi-experimental, and experimental designs.
Johnson & Christensen Educational Research, 4e. 1. Chapter 2: Quantitative, Qualitative, and Mixed Research. Lecture Notes. This chapter is our introduction to the three major research methodology paradigms. A paradigmis a perspective based on a set of assumptions, concepts, and values that are held and practiced by a community of researchers.
Chapter 2 Introduction. Chapter 2. Introduction. Maybe you have already gained some experience in doing research, for example in your bachelor studies, or as part of your work. The challenge in conducting academic research at masters level, is that it is multi-faceted. The types of activities are: Writing up and presenting your findings.
Key Concepts in Quantitative Research. In this module, we are going to explore the nuances of quantitative research, including the main types of quantitative research, more exploration into variables (including confounding and extraneous variables), and causation. Content includes: Objectives: Discuss the flaws, proof, and rigor in research.
The specificity of quantitative research lies in the next part of the defini-tion. In quantitative research we collect numerical data. This is closely connected to the final part of the definition: analysis using mathematically Chapter 1 Introduction to quantitative research 1 9079 Chapter 01 (1-12) 1/4/04 1:18 PM Page 1
This chapter considers the overall model of quantitative research, its main steps, its main principles and goals, and also its criticisms. It shows that quantitative research is only one possible approach to studying social world, with its own preoccupations, advantages and disadvantages. The Main Steps in Quantitative Research.
In part 2 of this chapter, we discussed how p-levels represent statistical "significance," or the probability of finding a "significant" answer only by chance, when no such relationship between variables actually exists in a particular subject population. ... As noted in Part 1 of this chapter, in quantitative research, you will often hear ...
What is Quantitative Research? Quantitative research is a formal, objective, rigorous, and systematic process for generating numerical information about the world. Quantitative research is conducted to describe new situations, events, or concepts, examine relationships among variables, and determine the effectiveness of interventions on ...
Analyzing a research report Critical thinking skill that involves determine the value of a study by breaking the contents of a study report into parts and examining the parts for accuracy, completeness, uniqueness of information, and organization
The materials are included in this chapter help in familiarizing information that is relevant and similar to the present study. This chapter presents literatures and studies related to the present research work that guided the researcher in the formulation of the conceptual and theoretical framework of the study. Review Literature. Local
This concise text provides a clear and digestible introduction to completing quantitative research. Taking you step-by-step through the process of completing your quantitative research project, it offers guidance on: • Formulating your research question • Completing literature reviews and meta-analysis • Formulating a research design and specifying your target population and data source ...
Revised on June 22, 2023. Quantitative research is the process of collecting and analyzing numerical data. It can be used to find patterns and averages, make predictions, test causal relationships, and generalize results to wider populations. Quantitative research is the opposite of qualitative research, which involves collecting and analyzing ...
These parts can also be used as a checklist when working through the steps of your study. Specifically, part 1 focuses on planning a quantitative study (collecting data), part two explains the steps involved in doing a quantitative study, and part three discusses how to make sense of your results (organizing and analyzing data). Research Methods.
Study with Quizlet and memorize flashcards containing terms like Abstract, Analyzing a research report, Applied research and more.
Chapter 2 Research Procedures. In Chapter 1, we covered the basic concepts of research in economics first by reviewing key terms in research and the roles of theory and data in the study of economics. We noted that the study of economics proceeds within the framework of scientific methods and we engaged in a general discussion of scientific ...
Chapter 2- Example - Free download as Word Doc (.doc / .docx), PDF File (.pdf), Text File (.txt) or read online for free. This chapter describes the research methodology used in the study. A quantitative research design using a correlational technique was employed. The respondents were 296 Grade 10 students from 3 public secondary schools in Nabunturan, Compostela Valley.
Chapter 2- Quantitative Research - Free download as Word Doc (.doc / .docx), PDF File (.pdf), Text File (.txt) or read online for free. This document summarizes previous studies related to bioplastics from various sources such as fish waste, starches, and plant materials. It notes that existing studies focus on bioplastics from either fish waste or starches individually, but not a combination.
Social workers' roles in science and research; I. Part 2: Quantitative research methods. 1. Research ethics. 6.1 Human subjects research; 6.2 Specific ethical issues to consider; 6.3 Benefits and harms of research across the ecosystem; 6.4 Being an ethical researcher; 2. Conceptualization in quantitative research. 11.1 Developing your ...
Quantitative structure-activity relationship (QSAR) modeling is an important part of chemical/biological data analysis and chemoinformatics. The low cost and high speed of screening of large chemical databases, make the QSAR analysis more efficient than the...
Practical Research 2 (Quantitative Research) - Free download as Word Doc (.doc / .docx), PDF File (.pdf), Text File (.txt) or read online for free. A discussion of Practical Research 2 (Definition, Types, Importance Across Fields, Characteristics, Limitations, Weaknesses, Research Topic, Problem, Questions and Title and Parts of Chapter 1)