Gantt Chart for a Research Project Proposal: Step-by-step guide

In project management, there are few tools as effective and illuminating as the Gantt chart . This simple yet powerful visual tool is invaluable for anyone overseeing a complex task, including research project proposals. It is particularly beneficial in the early stages of a project, where meticulous planning is required to ensure that all elements of the project are understood, accounted for, and scheduled appropriately. Therefore, whether you're an academic researcher, a project manager in a corporate setting, or even a student planning your thesis, understanding how to create and use a Gantt chart can be a significant asset.

What is a Gantt Chart and what is it used for?
A Gantt chart, named after its creator, Henry Gantt, an American mechanical engineer and management consultant, is a type of bar chart that visually represents a project schedule. It was first developed in the early 20th century and has since become a staple in project management across various fields and industries. Today, it's used by project managers in sectors like construction, software development, research and development, and more.
At its core, a Gantt chart consists of two main components: tasks and time. The tasks related to the project are listed on the vertical axis, while the horizontal axis represents time. Each task is represented by a horizontal bar, the length of which corresponds to the duration of the task.
Make your own Gantt chart in Gleek .
Gantt charts are incredibly useful for planning and scheduling projects, tracking progress, and managing dependencies between tasks. They provide a clear visualization of the project timeline and help to identify potential bottlenecks and overlaps. This makes them an ideal tool for coordinating teams, allocating resources, and keeping stakeholders informed.
The versatility of Gantt charts solves numerous problems faced by project managers. They simplify complex projects by breaking them down into manageable tasks and visualizing their sequence and duration. This can help in avoiding over-scheduling, underestimating deadlines, and mismanaging resources.
Whether you're a seasoned project manager or a student working on a research proposal, mastering the use of Gantt charts can significantly streamline your project planning process and enhance your team's productivity.
Components needed for Research project proposal diagram
Creating an effective research project proposal diagram requires several key components. These elements provide a comprehensive overview of the project, including its timeline, tasks, and significant milestones.
Project Stages: Each stage of your research project should be clearly defined. This can include the literature review, methodology development, data collection and analysis, results compilation, proposal drafting, peer review, and final edits.
Timeline: The timeline provides a visual representation of the project's duration. It should outline the start and end dates of the project, as well as the estimated completion time for each stage.
Tasks: Each task within the project stages should be clearly outlined. This includes what needs to be done, who is responsible for it, and when it should be completed.
Milestones: Milestones mark significant achievements or phases in your project. These can help track progress and ensure that the project is moving forward as planned.
Dependencies: Dependencies show the relationship between different tasks. It's crucial to highlight how the delay in one task can impact others.
Status: The status of each task and stage helps monitor the project's progress. It can indicate whether a stage is completed, in progress, or yet to start.
Notes/Comments: Any additional information, observations, or feedback about the project can be included here. This could be insights gained during the research, changes made to the project plan, or issues that have arisen.
By incorporating these components into your diagram, you can create a well-structured, transparent, and efficient project proposal.
Creating a Research project proposal Gantt chart using the Gleek App
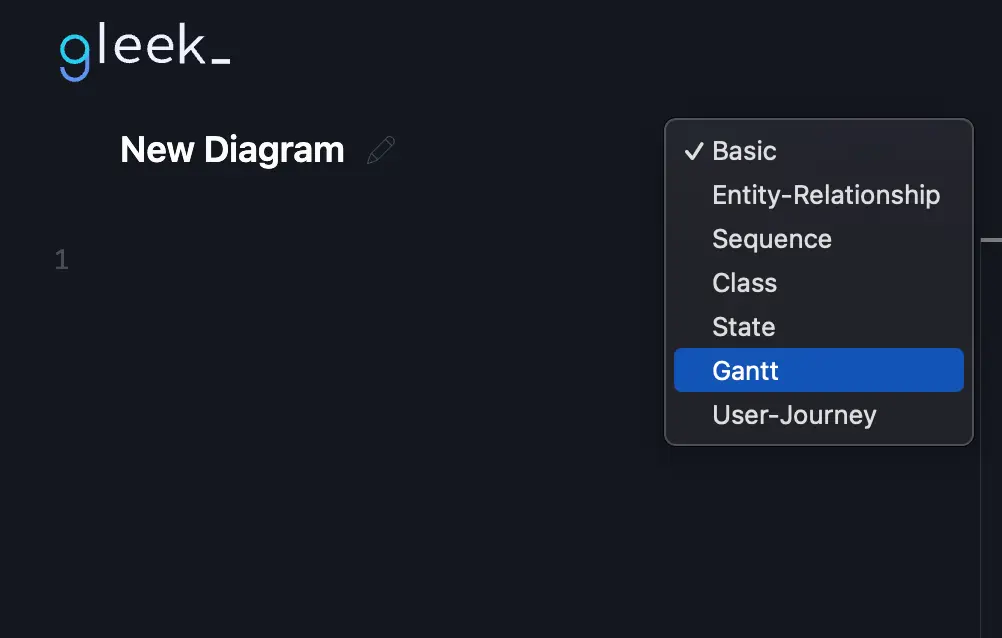
Step 1: launching gleek and selecting 'new diagram'.
First, launch Gleek.io in your web browser. Once you're in, select 'New Diagram' from the options available. In the diagram type, choose 'Gantt'.
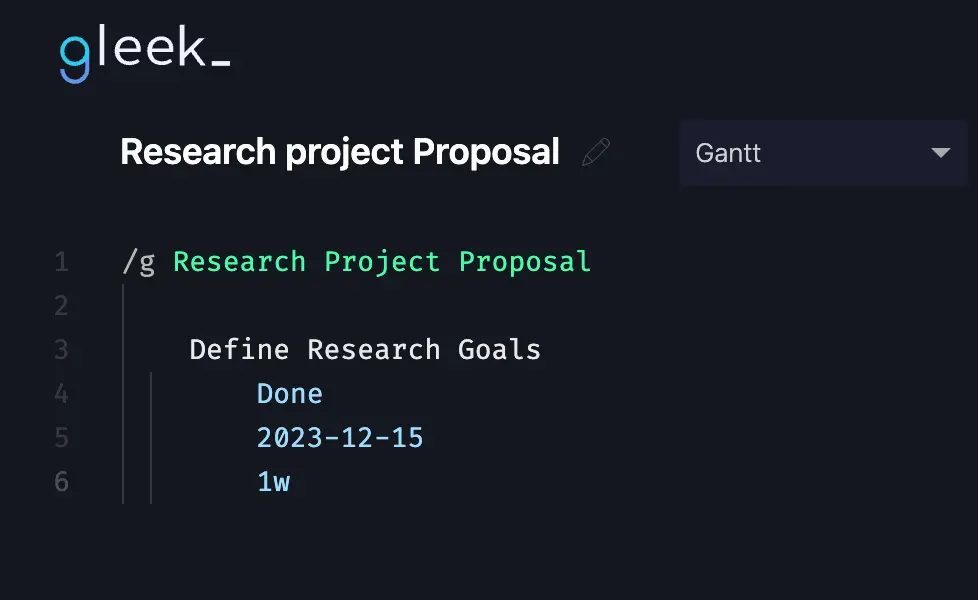
Step 2: Defining Research Goals
The research project initiates with an active phase dedicated to defining research goals, which commenced on December 15, 2023, lasting for a week. This phase involves brainstorming, outlining objectives, and establishing the research's overarching scope.
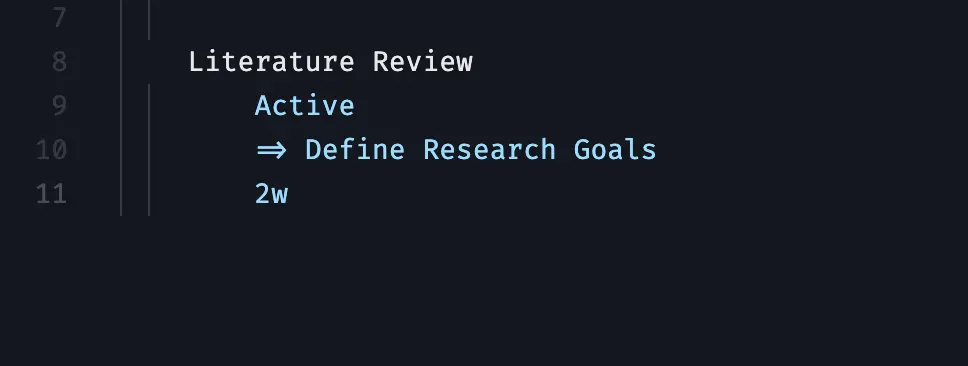
Step 3: Literature Review Phase
Transitioning to the next stage, we have the completed 'Literature Review' phase spanning two weeks. This phase entails an in-depth analysis, sourcing relevant publications, synthesizing existing knowledge, and aligning it with the predefined research goals.
Step 4: Methodology Design Phase
Progressing to the 'Methodology Design' phase, currently active for three weeks, this stage intricately structures the research approach. It involves designing methodologies, frameworks, and strategies based on insights gleaned from the literature review, ensuring a robust research plan.

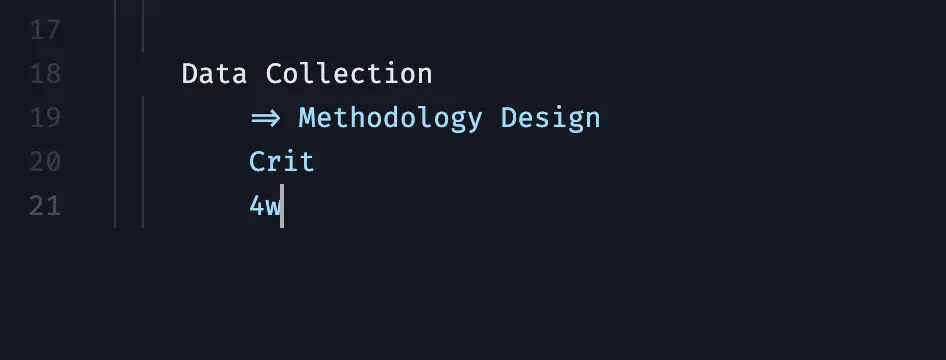
Step 5: Data Collection Phase
Following the planning stages is the critical 'Data Collection' phase, slated for four weeks. This phase involves meticulously gathering and assembling primary data, employing various methodologies such as surveys, experiments, or interviews, aligning with the established research framework.
Step 6: Data Analysis Phase
Post-data collection, the active 'Data Analysis' phase spans three weeks. This phase engages in thorough data examination, statistical analysis, and deriving insights from the accumulated information. It involves identifying patterns, correlations, or trends relevant to the research objectives.

Step 7: Results Compilation Phase
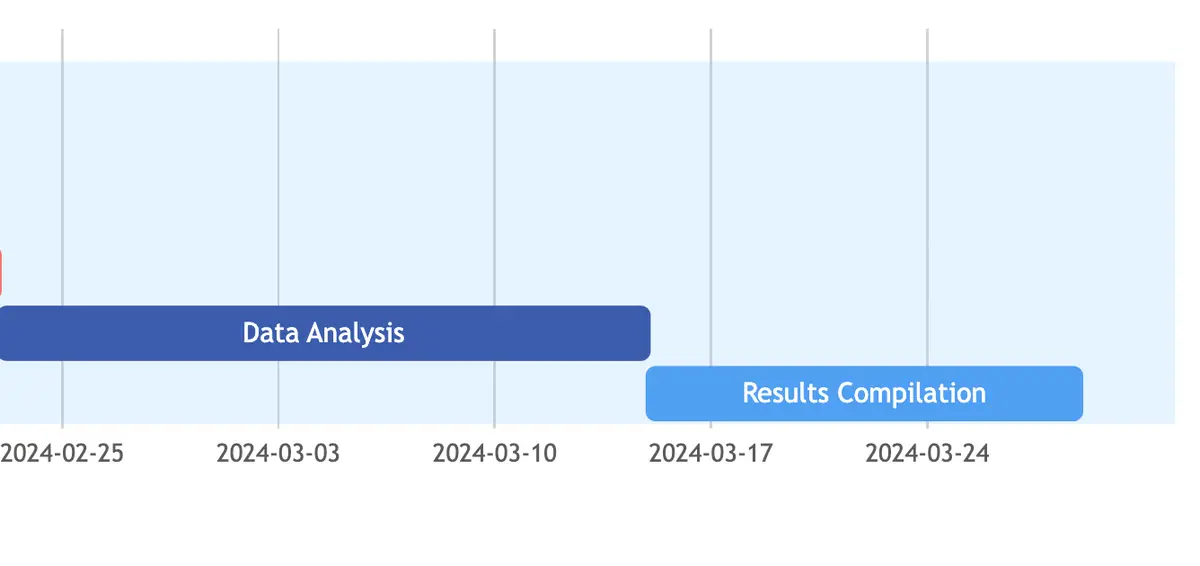
Subsequently, the 'Results Compilation' phase consolidates and organizes the analyzed data over two weeks, presenting it in a coherent format. This phase involves preparing comprehensive reports, graphs, or summaries, showcasing the findings derived from the data analysis stage.
Step 8: Drafting Proposal Phase
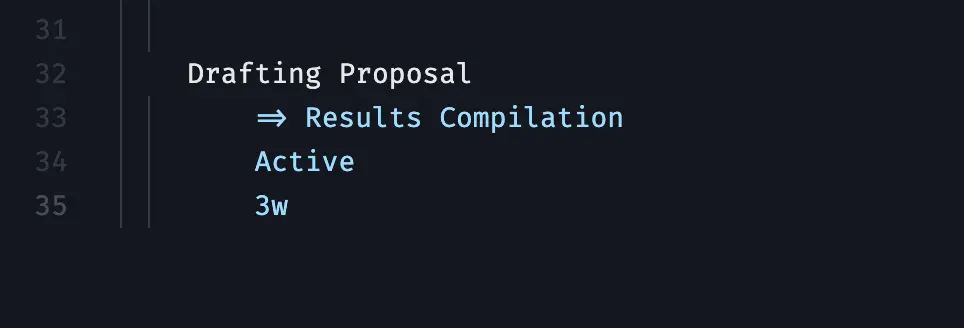
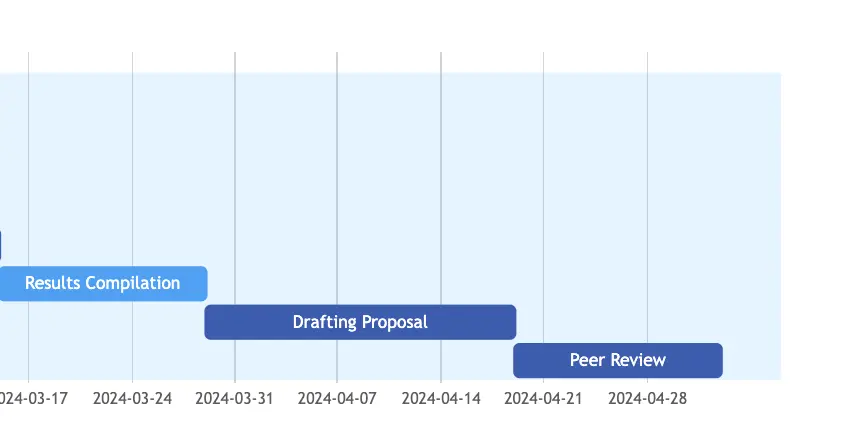
Advancing further, the active 'Drafting Proposal' phase, extending over three weeks, involves crafting the research proposal. It includes outlining the research problem, detailing methodologies, and structuring a cohesive proposal aligned with the project's objectives.
Step 9: Peer Review Phase
Upon completion of the draft, the two-week 'Peer Review' phase gathers insights and constructive feedback from peers or subject experts. It involves peer evaluations, discussions, and recommendations aimed at refining and enhancing the proposal's quality.
Step 10: Final Edits
Finally, the one-week active 'Final Edits' phase focuses on meticulous revisions, addressing feedback, and ensuring the proposal's completeness, accuracy, and compliance with set standards. This stage includes proofreading, formatting, and polishing the final document.

Step 11: Proposal Submission Milestone
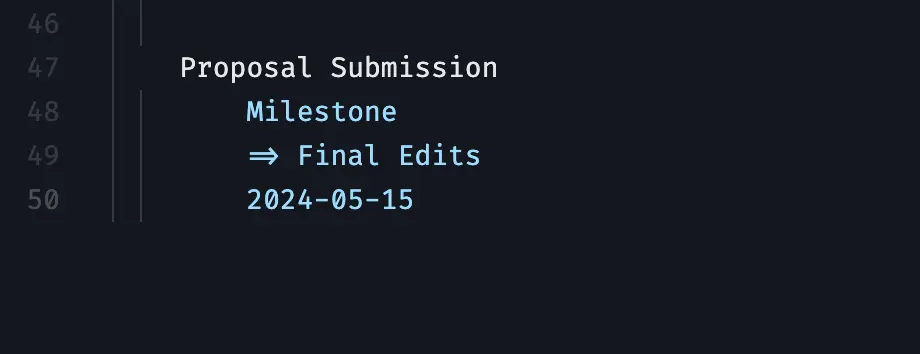
The 'Proposal Submission' milestone, set for May 15, 2024, marks the conclusive stage, signifying the submission of the crafted and refined research proposal for evaluation and potential implementation.
Hurray, You Did It!
And there you have it! Your Research Project Proposal Gantt Chart is now complete.

This comprehensive diagram, with its clearly defined stages, tasks, timeline, dependencies, resources, and status, provides a holistic view of your research project. It not only serves as a visual representation of the entire project but also acts as a roadmap guiding you from the initial brainstorming phase to the final proposal submission. Utilizing such a diagram can greatly enhance your project planning and execution, ensuring all aspects are considered, dependencies are taken into account, and milestones are tracked. It fosters better coordination, communication, and understanding among team members, leading to more efficient and effective project management.
About Gleek.io
Gleek.io is a powerful tool that can further enrich your project planning needs. It's an intuitive app designed to help you visualize complex ideas, processes, and systems through various types of diagrams. Whether you need to create a flowchart, UML diagram, or even a Gantt chart like the one we've just built, Gleek.io makes the process straightforward and hassle-free.
With its keyboard-centric approach, Gleek.io allows you to create diagrams faster than traditional drag-and-drop tools. You can quickly jot down your ideas and see them evolve into structured diagrams in real-time, making it an ideal tool for brainstorming sessions, project planning, and presentations.
In conclusion, Gleek.io is more than just a diagramming tool. It's a platform that enables you to visualize your thoughts, communicate complex ideas simply, and manage your projects more effectively. Give it a try for your next project and experience the difference it can make!
Related posts
Beyond Traditional Planning: Top Gantt Chart Alternatives in 2024
Gantt chart critical path explained
Visual project management: Gantt Charts vs. Timelines explained
Pert vs. Gantt Charts: Choosing your project's blueprint
back to all posts
- Thesis Action Plan New
- Academic Project Planner
Literature Navigator
Thesis dialogue blueprint, writing wizard's template, research proposal compass.
- Why students love us
- Rebels Blog
- Why we are different
- All Products
- Coming Soon
Creating a Research Proposal Gantt Chart: An Example to Follow

Creating a Gantt chart for your research proposal can transform the way you plan and manage your project. This visual tool helps you organize tasks, set deadlines, and track progress, ensuring that you stay on schedule and meet your objectives. Whether you're a student or a seasoned researcher, a Gantt chart can make your research journey smoother and more efficient.
Key Takeaways
- A Gantt chart helps you visualize your research timeline and tasks clearly.
- It allows you to identify dependencies and critical paths to avoid delays.
- You can set realistic deadlines and allocate resources effectively.
- Tracking progress and making adjustments becomes easier with a Gantt chart.
- Using a Gantt chart improves communication and collaboration with your team.
Understanding the Importance of a Research Proposal Gantt Chart
A research proposal Gantt chart serves as a research proposal compass that provides comprehensive guidance, bridging perspectives, and a logical structure for crafting successful research proposals. It streamlines progress from idea to proposal, easing anxiety and confusion.
Components of an Effective Research Proposal Gantt Chart
Creating a research proposal Gantt chart involves several key components that provide a clear overview of your project. These elements help you visualize your timeline, tasks, and significant milestones.
Essential Elements to Include
To build an effective Gantt chart, you need to include the following essential elements:
- Tasks and Subtasks : Break down your research proposal into manageable tasks and subtasks.
- Timeline : Clearly define the start and end dates for each task.
- Milestones: Identify significant milestones to track your progress.
- Dependencies: Show how tasks are related and dependent on each other.
- Resources: Allocate resources like time, people, and materials to each task.
Visualizing Dependencies and Critical Paths
Understanding dependencies and critical paths is crucial for smooth project progress. Dependencies show how tasks are connected, while the critical path highlights the sequence of tasks that directly impact your project's completion date. By visualizing these elements, you can:
- Easily identify potential bottlenecks.
- Adjust timelines to avoid delays.
- Ensure all tasks are completed in the correct order.
Utilize technology tools like Evernote, Zotero, and Trello for efficient thesis writing. Organize research, create a plan, manage references, and citations systematically.
Step-by-Step Guide to Creating a Research Proposal Gantt Chart
Creating a Research Proposal Gantt Chart can seem daunting, but breaking it down into manageable steps makes the process straightforward. This guide will walk you through each step, ensuring you have a clear and structured plan for your research project.
Launching the Gantt Chart Tool
To begin, you need to select a Gantt chart tool. There are many options available, such as Creately, which allows you to enter tasks, timelines, dependencies, resources, and milestones. Use Gantt chart software or tools like Creately to create the chart. This will help you visualize your project timeline and tasks in a clear and structured way.
Defining Research Goals and Objectives
Next, outline your research goals and objectives. This step is crucial as it sets the foundation for your entire project. Clearly defined goals will guide your planning and ensure that every task aligns with your overall objectives. Think about how to start thesis work and what you aim to achieve.
Setting Milestones and Deadlines
After defining your goals, set realistic milestones and deadlines. This helps in tracking progress and making necessary adjustments to stay on schedule. Identify key tasks and allocate resources effectively. By setting these milestones, you can ensure smooth progress and timely completion of your research proposal.
Utilizing the Master Research Proposal Gantt Chart Template
By utilizing the Master Research Proposal Gantt Chart Template , you can effectively plan and manage your research project, ensuring its successful completion.
Case Study: A Research Proposal Gantt Chart Example
Overview of the case study.
In this case study, we will explore how a well-structured Gantt chart can streamline the planning and execution of a research proposal. The Gantt chart shows the timelines of the various steps of the project including their dependencies and any resources needed. By visualizing these elements, you can ensure that your project stays on track and meets its deadlines.
Key Takeaways from the Example
- Clear Visualization : The Gantt chart provides a clear visual representation of the project timeline, making it easier to identify key milestones and deadlines.
- Dependency Management : Understanding the dependencies between tasks helps in planning the sequence of activities effectively.
- Resource Allocation: The chart helps in identifying the resources needed at each stage, ensuring that there are no bottlenecks.
- Progress Tracking: Regular updates to the Gantt chart allow for tracking progress and making necessary adjustments to stay on schedule.
- Improved Communication: The Gantt chart serves as a communication tool, helping team members understand their roles and responsibilities.
By following this example, you can create a Gantt chart that not only outlines your research question but also helps in managing the entire research process efficiently.
Best Practices for Managing Your Research Project with a Gantt Chart
Tracking progress and making adjustments.
To keep your research project on track, it's crucial to regularly monitor your progress. Update the statuses of your tasks frequently, marking them as Complete, In Progress, or To Do. This helps you stay organized and ensures that you can make timely adjustments if needed. By mastering time management , you can optimize productivity and ensure timely completion of tasks.
Effective Communication with Your Team
Clear communication with your research team is essential for the success of your project. Use the Gantt chart to visualize your research timeline and tasks, making it easier for everyone to understand their responsibilities. This not only improves collaboration but also helps in identifying dependencies and critical paths, ensuring smooth progress throughout the project.
Common Mistakes to Avoid When Using a Gantt Chart for Research Proposals
When using a Gantt chart for your research proposal, it's crucial to avoid certain pitfalls that can hinder your project's success. Overloading the chart with details can make it difficult to read and manage. Instead, focus on key tasks and milestones to keep it clear and concise. Ignoring dependencies and critical paths is another common mistake. Make sure to visualize dependencies to ensure smooth progress and avoid delays.
Advanced Tips for Optimizing Your Research Proposal Gantt Chart
Incorporating feedback and revisions.
To ensure your Gantt chart remains effective, regularly incorporate feedback from your team and stakeholders. This helps in refining your project plan and addressing any potential issues early on. Regular updates based on feedback can significantly improve the accuracy and reliability of your timeline.
Utilizing Software Features for Better Management
Modern Gantt chart tools come with a variety of features that can help in maximizing resources: smart budgeting for successful research projects. Key strategies include effective resource allocation, time management, and optimizing data collection methods using technology. Make sure to explore and utilize these features to enhance your project management. For instance, automated notifications can keep your team informed about upcoming deadlines, while dependency tracking ensures that all tasks are aligned properly.
How to Find Good Literature
Finding good literature is crucial for the success of your research project. Use academic databases, libraries, and online resources to gather relevant information. Keeping your Gantt chart updated with literature review milestones can help you stay on track and ensure that you have a solid foundation for your research. Effective literature review can also highlight gaps in existing research, guiding your project in a meaningful direction.
Comparing Different Gantt Chart Templates for Research Proposals
When it comes to managing your research proposal, selecting the right Gantt chart template can make a significant difference. Different templates offer unique features that cater to various project needs. For instance, the Master Research Proposal Gantt Chart Template is designed to help you break down your project into manageable tasks and visualize the timeline effectively. This template allows you to track progress and ensure timely completion of all project components, making it a great choice for graduate students.
Here’s a quick comparison of some popular Gantt chart templates:
| Template Name | Key Features | Best For |
|---|---|---|
| Master Research Proposal Gantt Chart | Fully customizable, visualizes dependencies | Graduate students |
| Contractors Gantt Chart Template | Focus on project management for construction projects | Contractors |
| Health Promotion Program Gantt Chart | Tailored for health-related research projects | Health researchers |
| Investment Bankers Gantt Chart | Financial project management | Investment bankers |
By choosing the right template, you can improve communication and collaboration with your team, ultimately increasing your chances of completing your research proposal on time and with success. Remember, the goal is to visualize your project timeline and tasks in a clear and structured way, so select a template that aligns with your specific needs and project goals. Utilizing the right tools will help you stay organized and focused throughout your research journey.
The Role of Gantt Charts in Qualitative Research Proposals
Benefits of using gantt charts in qualitative research.
Planning and managing a qualitative research project can be a daunting task. However, with a Gantt chart, you can streamline the process and achieve success. Gantt charts help you set clear goals and objectives , making it easier to stay on track. They also allow you to explore unique angles and compare topics effectively. By using a Gantt chart, you can ensure that your research is well-organized and that deadlines are met.
Key Elements of a Qualitative Research Gantt Chart
A qualitative research Gantt chart includes several essential elements. These elements help you visualize the entire research process and keep everyone on the same page. Key elements include:
- Project tasks: Define your project tasks clearly.
- Milestones: Set important milestones to track progress.
- Deadlines: Establish deadlines to ensure timely completion.
- Dependencies: Identify dependencies to understand the relationship between tasks.
By incorporating these elements, you can create a comprehensive timeline that keeps everyone on track and smoothly navigates your qualitative research journey.
Gantt charts can be a game-changer for your qualitative research proposals. They help you plan and track your progress, making sure you meet all your deadlines. If you're struggling with your thesis, our step-by-step Thesis Action Plan can guide you through every stage. Visit our website to learn more and claim your special offer today !
Creating a Research Proposal Gantt Chart is a vital step in ensuring the success of your research project. By breaking down your project into manageable tasks and setting clear deadlines, you can stay organized and on track. The Master Research Proposal Gantt Chart Template is an excellent tool to help you visualize your timeline, identify dependencies, and allocate resources effectively. Whether you are a beginner or an experienced researcher, this template can simplify the planning process and improve collaboration within your team. With careful planning and the right tools, you can increase your chances of completing your research proposal on time and achieving your academic goals.
Frequently Asked Questions
What is a research proposal gantt chart.
A research proposal Gantt chart is a visual tool that helps you plan and schedule your research activities over time. It shows tasks, deadlines, and how different tasks depend on each other.
Why is a Gantt chart important for research proposals?
A Gantt chart is important because it helps you organize your research, set realistic deadlines, and track your progress. It also makes it easier to communicate your plan to others.
What are the key benefits of using a Gantt chart?
Using a Gantt chart helps you visualize your project timeline, identify task dependencies, set deadlines, allocate resources, track progress, and improve team communication.
What should be included in a research proposal Gantt chart?
A good research proposal Gantt chart should include tasks, milestones, deadlines, dependencies, and critical paths. This helps in planning and tracking the project effectively.
How do I create a research proposal Gantt chart?
To create a Gantt chart, start by listing your research goals and tasks. Then, set deadlines and milestones. Use a Gantt chart tool to visualize the timeline and dependencies of your tasks.
Can I customize the Master Research Proposal Gantt Chart Template?
Yes, the Master Research Proposal Gantt Chart Template is fully customizable. You can adjust it to fit the specific needs and goals of your research project.
What are common mistakes to avoid when using a Gantt chart?
Avoid overloading the chart with too many details and ignoring task dependencies and critical paths. Keeping it simple and clear is key to effective planning.
How can I track progress using a Gantt chart?
You can track progress by updating the status of tasks and milestones on your Gantt chart. This helps you see what’s completed, what’s in progress, and what’s delayed.

Discovering Statistics Using IBM SPSS Statistics: A Fun and Informative Guide

Unlocking the Power of Data: A Review of 'Essentials of Modern Business Statistics with Microsoft Excel'
Discovering Statistics Using SAS: A Comprehensive Review

How to Deal with a Total Lack of Motivation, Stress, and Anxiety When Finishing Your Master's Thesis

Mastering the First Step: How to Start Your Thesis with Confidence

Thesis Revision Made Simple: Techniques for Perfecting Your Academic Work

Thesis Action Plan

Integrating Calm into Your Study Routine: The Power of Mindfulness in Education
How to determine the perfect research proposal length.
- Blog Articles
- Affiliate Program
- Terms and Conditions
- Payment and Shipping Terms
- Privacy Policy
- Return Policy
© 2024 Research Rebels, All rights reserved.
Your cart is currently empty.
Get started
- Project management
- CRM and Sales
- Work management
- Product development life cycle
- Comparisons
- Construction management
- monday.com updates
How to use a Gantt chart for a research project
Using a Gantt chart for a research project can give all stakeholders a better understanding of timelines and the resources needed for each task. With all project activities neatly laid out within a timeline and every minor detail accounted for, a Gantt chart provides your team with the framework for successful project operations.
In this article, we’ll discuss a Gantt chart and how you can use it in a research project to maximize efficiency and promote greater transparency. We’ll also share how you can use monday.com’s project management Work OS to simplify the management of any research project further.
What is a Gantt chart?
A Gantt chart is a bar chart popularized in the early 1900s by Henry Gantt. It lets you establish a detailed project plan according to when you need each task completed.
If done correctly, a Gantt chart creates a realistic time frame for a project by establishing a start date for the whole project and each task. Then, you can pair these start dates with an estimation of how long the task will take, broken down by days, weeks, or months.
What makes a Gantt chart unique is that it establishes dependency relationships between all relevant tasks, which can help you better understand necessary workflows.
For example, let’s say you’re creating a research proposal. One of your tasks is to promote awareness and garner support for the proposal on social media. However, before you can do that, you need to create informational materials you can distribute and have the proposal outline ready for viewing. Since these necessities are clearly outlined in the Gantt chart, you can plan your project timeline accordingly.
How can you use a Gantt for research projects?
Research projects are vast undertakings that require a lot of your time, effort, and brain power. Sometimes it’s easy to get sidetracked or confused about what comes next in your research or how you should put it together.
A clear understanding of objectives and deadlines can help you organize even the most complex research project undertakings. Even better, a Gantt chart provides clear step-by-step instructions with dependency relationships marked to ensure every team member understands their responsibilities.
A Gantt chart ensures all research project team members clearly understand objectives, deadlines, and task dependency relationships.
Best practices for planning and scheduling a research project
Understanding the best practices for planning and scheduling a research project can help you get the most out of your Gantt chart . A few best practices include:
- Have a clear goal : Before sitting down to plan your research project, ask yourself some crucial questions. What are you trying to achieve? Why are you trying to achieve it? When do you need to complete it?
- Use scheduling tools : Use task and resource scheduling tools when possible to reduce the risk of human error.
- Get the team involved : Gather your team together for a brainstorming session, if possible, when developing a list of tasks required to meet your final objective.
- Consider dependency relationships : Consider the dependency relationships between objectives carefully and be realistic about time frames. Ensuring your team has enough time to successfully and thoroughly complete each task from the beginning sets your research project up for success.
- Identify potential issues : Identify risks and potential roadblocks in your schedule and have a backup plan for each to ensure a steady workflow with minimal pushbacks.
- Consider resource requirements : Consider the resources necessary to complete each task. Remember to include work hours as resources and schedule each team member appropriately to achieve objectives in the desired time frame.
- Plan for reporting : Assign specific times, or interval periods, for progress reports and compare these with your initial estimations. If these reports show alterations are necessary, don’t be afraid to make changes.
- Identify KPIs : Before the research project begins, identify key performance metrics and track them as you go to define your success clearly. You may find using a relevant tool or platform the easiest way to track performance metrics.
Having the right Gantt chart tools can increase efficiency, decrease downtime, and ensure objective deadlines are not only met but exceeded.
Managing research projects on monday.com
monday.com’s robust project management Work OS makes managing research projects easier by:
- Centralizing projects from start to finish : Our Work OS lets you centralize all projects from conception to completion, with customizable dashboards that show you the information you deem most important. Quickly assess risks, bottlenecks, and roadblocks to keep your research project moving forward.
- Streamlining project workflows : Streamline workflows by automating routine tasks and assigning teammates to the work they’re most qualified for. Then, track individual and project-wide progress in real-time with regular task updates. Use color coding to make task management even more straightforward.
- Enabling communication across teams : Our Work OS promotes communication between project members and across different teams, so all stakeholders know where things stand at all times. You can share documents, leave notes, and work together in real-time for more effective communication that allows you to exceed every deadline and meet every objective.
monday.com can provide your team with a Gantt chart view to make project management easier. Get started with monday.com’s powerful Work OS by building a research project workflow from scratch or try a few of our other templates for managing research projects easier.
Related templates
A basic Gantt chart can help you plan your research project in detail. On monday.com, you can add a Gantt View to any type of project board. Below are some of our recommended templates from our Template Center that you can use to fine-tune other essential aspects of your research project.
Keyword power tools template
Our Research Power Tools Template uses a Gantt chart format to help you visualize project timelines, manage project resources, and monitor each phase of your research projects from one platform.
Publication and journals template
Our Publications and Journals Template is an excellent tool for content publishing companies. You can use our template to:
- Manage your publication process: Our template enables whole-process management from submission to approval. Easily track article status and monitor writer workload to ensure you meet publishing deadlines.
- Visualize your publishing pipeline: Customizable dashboards allow you to receive a high-level overview of all current and upcoming articles and where they stand.
- Track individual contributions: Ensure each writer meets minimum contributions and isn’t given too large a workload by tracking individual contributions.
By now, you should have a working idea of Gantt charts and how they increase transparency and efficiency in project management. However, if you still have questions, we’ve answered a few FAQs below.
How do you create a dissertation in a Gantt chart?
To create a Gantt chart for a dissertation, you should first understand your timeline and deliverables. Once you’ve written these down, create detailed task lists of how you’ll accomplish each deliverable and consider dependency relationships between each. Finally, use the Gantt chart to outline your dissertation from start to finish.
What should be in a dissertation timeline?
In a dissertation timeline, you should include the following:
- Role assigning (if applicable)
- Research tasks
- Experiments, social or scientific (if applicable)
- Data collection and analysis
- First draft completion
- Submission to the advisor (first) and dean (at completion)
How do you create a Gantt chart in Word?
You can create a Gantt chart in Microsoft Word by:
- Opening a new Word document
- Change the document orientation from vertical to horizontal
- Insert a bar graph into your document
- Make format alterations as necessary to make the graph look like a Gantt chart
- Insert information and customize as necessary
Any team can increase transparency in their research projects with monday.com
Using a Gantt chart to create a detailed project timeline can help increase transparency and promote greater efficiency in your organization’s research projects.
When you pair a Gantt chart with monday.com’s robust project management system, you have the tools you need to meet deadlines, complete objectives, and exceed expectations.
Send this article to someone who’d like it.
The Research Whisperer
Just like the thesis whisperer – but with more money, how to make a simple gantt chart.
In every grant application, I want to see a simple visual guide (a Gantt chart ) that shows what you are planning to do. It is the perfect time to plan your project clearly. It shows the assessors that you have thought about your research in detail and, if it is done well, it can serve as a great, convincing overview of the project.
Clearly, these charts are hard to do. If they were easy, more people would do them, right?
Here are five steps to create a simple guide to your research project.
1. List your activities
Make a list of everything that you plan to do in the project. Take your methodology and turn it into a step-by-step plan. Have you said that you will interview 50 people? Write it on your list. Are you performing statistical analysis on your sample? Write it down.

Check it against your budget. Everything listed in the budget should also be listed on your uber-list? Have you asked for a Thingatron? Note down that you will need to buy it, install it, commission it… What about travel? Write down each trip separately.
2. Estimate the time required
For each item on your list, estimate how long it will take you to do that thing. How long are you going to be in the field? How long will it take to employ a research assistant? Realistically, how many interviews can you do in a day? When will people be available?
Initial meeting: about 3 weeks to find a time. Desk audit: 4 months. Draft key elements: about 1 week each. Testing: about 1 week each, but can start organising as soon as first element is drafted. Write up: 2 months. Final report: no time, really – just need to find a time to meet.
Generally, I use weeks to estimate time. Anything that takes less than a week I round off to a week. Small tasks like that will generally disappear from the list when we consolidate (see Step 4). Then I group things together into months for the actual plan.
3. Put activities in order
What is the first thing that you are going to do? What will you do next? What will you do after that?
In the comments, Adrian Masters provided some great questions to help with this stage: What do I need to do by when? What do I need from others & when? How do I check that I am still on track?
One by one, put everything in order. Make a note of any dependencies; that is, situations where you can’t do one thing until another is started or finished. If the research assistant is going to do all the interviews, then the interviews can’t start until the research assistant is hired.
Where possible, you should eliminate as many as possible dependencies. For example, if you can’t find a decent research assistant, you will do the fieldwork yourself (but that might mean that work will be delayed until you finish teaching). It isn’t a necessary step to getting your time-line in order, but it is good project management practice.
In the comments, Amy Lamborg pointed out that you might want to work backwards . If you have a fixed end date, you might want to “…build back towards the project start date, then jiggle everything until it fits !” If you want an example of this, have a look at the post “ Work backwards “. It is about writing an application, but the principle of starting with the fixed end date and working backwards still applies.
4. Chunk it up
Now that you have an ordered list, and you know how long everything will take, you need to reduce the list without losing any specificity. At the same time, if you are combining tasks, you might want to add a bit of time as a contingency measure.
Meet with partners: 3 weeks. Review data protection regimes: 4 months. Draft three key elements: 3 months. Test three key elements: 3 months, with some overlap. Analyse test results and report: 3 months.
How you divide up your time depends on your project. If it is only one year long, you might list items by month. If your project is three years long, then you might list items by quarter. If you are planning over five years, you might break it down to six-month periods.
5. Draw me a picture
If you use project management software to manage your project, and you are comfortable with it, then use it to produce a summary of your project, too.
Most project management software (e.g. like Microsoft Project) will allow you to group activities into summary items. Chunk your tasks into major headings, then change the time interval to your months, quarters, half-years, or whatever you have chosen to use.
Or you can just draw it up with word-processing software (which is what I always do), spreadsheet software, or even hand-draw it.

Frankly, I don’t care – as long as it ends up in your application!
Also in the ‘simple grant’ series:
- How to write a simple research methods section .
- How to make a simple research budget .
Share this:
62 comments.
This is useful. I’m writing my first SERIOUS research proposal for my PhD. Obviously not something I’ve ever done before so all advice is greedily welcome.
My best advice – write something quickly and then get someone else to look at it. I’m a big fan of quick iterations to get started.
Your readers might be interested in Tom’s Planner ( http://www.tomsplanner.com ). It’s a very easy tool to help you create a schedule or project plan (and there is a free version). On our blog we have a bunch of guest blogs about planning your thesis or dissertation with a template and example to help you get started.
The free version is a farce you cannot print, export or do anything but view it online. So don’t waste time with this product it is not a real proof of concept.
Sometimes, when the chunks are too big, you end up failing to understand what’s in those chunks, then your estimate ends up WAY off when you realize the extra work you didn’t consider might go into a give task.
That looks like a useful technique for getting the right information together for a Gantt. I’d be interested in any techniques for step 5. It’s something I’ve done recently as part of my first year PhD report and I wrote about how I produced my Gantt chart here: http://phdtools.blogspot.com/2011/08/creating-gantt-charts.html
I can’t imagine many people use MS project to manage their entire PhD (I could be wrong?) therefore it seems a bit excessive to use it just for a Gantt chart. Equally I find Excel plots look a bit naff and it’s difficult to show linkages between items.
“I’m not looking for a tool to perform PERT or CPM or do resource levelling for me.”
Absolutely! I just want to plug in my info and get a simple image out. How hard is that?
I’m not a big fan of big-iron project management tools either. More time seems to go into managing the information than getting actual work done.
I do think that most group projects that are going to last twelve months or more could do with a simple project management tool, though. I’m a bit of a fan of Basecamp , even if it doesn’t draw Gantt charts.
Of course, everybody has to understand the tool and want to use it, which is a different matter.
Thanks for the post.
I’m currently trying my hand at project management software, but I seem to find it easier to simply write down stuff in a piece of paper before committing it to electronic format. Anybody else has the same issue?
Absolutely, Carlos. As someone who has managed a big project that included spending a lot of time wrangling MS Project, I’m a big fan of just scribbling it down on paper and then mocking it up in MS Word.
[…] How do you create a Gantt chart? The best advice we have seen is at the useful Research Whisperer blog, where they list 5 steps to creating your very own Gantt Chart in the post ‘How to make a simple Gantt chart’. […]
Excellent introduction to project planning. I’ve seen recent examples of project managers jumping into MS Project without this level of thinking, with predictable results.
Questions that should help (and which you would need to answer anyway when asked by seeking funding or approval) include: What do I need to do by when? What do I need from others & when? How do I check that I am still on track?
Build those answers into the simple paper approach above, and you’ll have covered the critical project basics (activities, resources, dependencies, scheduling, milestones and checkpoints)
Like Liked by 1 person
Thanks, Adrian.
I liked your questions so much, I added them into the original post. 🙂
An Excel bar chart is pretty much all you need to create a Gantt chart. Unless of course you intend to explore resourcing and costs.
Your info really helped me by doing my D.T ( Design Technology) homework. Thank You 🙂 Eirene Masri From Jordan, Amman
Thanks for your comment. It made me smile. 🙂
I haven’t been to Jordan for a very long time, but I had a great time when I was there.
[…] that you are going to do? What will you do next? What will you do after that? In the comments, Adrian Masters provided some great questions to help with this […]
Thanks for this particular piece of ‘whisper’… I was in a dire need of a ‘quickie’ method to make a simple Gantt Chart. 😀
Cheers, Yan London
No worries, Yan. Happy to help.
[…] Jonathan. “How to make a simple Gantt Chart” The Research Whisperer. 13 September […]
I have just gone through.Iam also planning to undertake a phd programme and would want to recieve guild as i make progress using gantt Chart
Reblogged this on Queer Fear: Alternative Gothic Literary and Visual Cultures and commented: Stumbled across this useful piece on the use of Gantt charts in research projects. I realise this may seem rather common knowledge to scientists but as a Arts and Humanities-based person I found it gave useful insights for new researchers.
Thanks, Hanoconnor.
I suspect that there are plenty of science people who don’t get any formal training in this, either.
good job. very helpful
[…] Read More At: https://theresearchwhisperer.wordpress.com/2011/09/13/gantt-chart/ […]
This is my first time using a Gantt chart in research paper.. hmm. thanks for the info. 🙂
Gantt charts are really useful. Thanks for posting this information about gantt charts. This is a very informative post and very helpful, too.
Thanks Jonathan. I have just completed my first Gantt chart for my Doctorate in Health. I was beginning to get a bit jumpy about some of the very involved instructions I had found previously so your ‘idiots guide’ was really helpful.
No worries, Ade.
Happy to help. Good luck with your doctorate.
I have been using a Gantt chart to plan and track my doctorate since I began last year. It’s just an Excel spreadsheet but suits my purposes, very simple. One thing I’ve found useful us to mark all the highlighted cells bright blue initially, for ‘future action’. Each week, I update that week’s column to green (completed) or red (overdue). This gives me good feedback not only about where I need to change the priorities on my current ‘to do’ list, but is a very satisfying display of how much I’ve already done.
I love Excel, postgradpanda. I reckon that seeing the blue change to green would be very satisfying.
Thanks for this.
[…] https://theresearchwhisperer.wordpress.com/2011/09/13/gantt-chart/ […]
Thanks for this. It helped me alot for doing our work schedule in research for short allotted time.
Ohh Thank God Jonathan for that!! you have no idea how much you saved my life.. I was having a real hard time planning my first ever research proposal Loved it alot.. Looking forward for much guidance along the path!!!
Sruti… (From a far far away land.. INDIA)!! 🙂
Thanks, Sruti
Happy to help.
Sruti was right. It’s very helpful to me as well. Saves me a lot of trouble. Keep it up Jonathan.
No worries, Paul
Are you a commercial representative for Ganttic, or did you link to them because you like them? Just wondering.
[…] published a short article about doing research in academia. Some of their articles are mundane (How to make a simple Gantt chart), whereas others are more esoteric (Hashing it over) and heartfelt (Academic […]
[…] out your timeline and your budget. Working up a Gantt chart for your project will force you to think about how long different phases of the project will take. This is important […]
list any six elements that go into the format of a research report?
Hi abukamara
I don’t have a set list. It depends who your audience is, and what sort of report you are writing.
I’m usually helping people to write grant applications, where the format is set by the funding agency. They make it pretty simple, really – they generally tell you exactly what they want.
[…] logframe analysis is well worth reading, while the Research Whisperer explains how to make a simple Gantt chart. And Mind Tools overviews a range of project scheduling tools as does this from MIT. Over at […]
[…] take you three or maybe three-and-a-half years. However, PhDs in my area rarely follow the sort of gantt chart anybody approving funding, ethics clearance or candidature milestones might approve. A tangent I […]
[…] How to make a simple Gantt chart – Jonathan O’Donnell. […]
Jonathan, i suppose that you should try more intuitive service) My experience in project management tells me there are a lot of comlicated tools such as MS Project. After years of searching and trying (Wrike, Liquid Planner, Smartsheet) i start using GanttPRO, especially because of its simplicity and high visibility. So try GanttPRO to facilitate workflow.
[…] O’Donnell, J 2011, How to make a simple Gantt chart, The Research Whisperer, weblog, 13 September, viewed 23 April 2017, < https://theresearchwhisperer.wordpress.com/2011/09/13/gantt-chart/> ;. […]
[…] research design is important. Following the steps outlined in O’Donnell’s (2011) blog How to make a simple Gantt Chart, I constructed this graph and a risk matrix to ensure that my time was used efficiently. […]
[…] Other tips on Gantt charts, including how to make one manually: https://theresearchwhisperer.wordpress.com/2011/09/13/gantt-chart […]
Thanks Jonathan! I am a grant writer, and your post is a great reminder that I should probably make a timeline visually appealing, like your hand-made Gantt. I’m going to do it!
I wanted to point out that for a grant funded project (which often has a specified end date by which the money must be spent), I often find myself making a timeline backwards. That is, I start creating the timeline from the specified end date, and then ask myself the questions that Adrian Masters posed: What do I need to do by when? What do I need from others & when? I build back towards the project start date, then jiggle everything until it fits!
BTW, did you know that in your text descriptions of the example timeline, the time is in weeks, but in your Gantt chart the time is in months? I have a feeling that you really meant for these to match….
Like Liked by 2 people
Thanks, Amy
This article has been viewed over 150,000 times, and you are the first person to point out the weeks / months issue. I’ve fixed it now (although it is a bit of a bodge).
I agree with the backwards process, so much so that I wrote a post about it: Work backwards . It is about the grant writing process, but the principle is the same.
This particular instance was one of those rare times when I truly didn’t have an end date, and could work out the actual time the project would take (surprise – it took longer).
I’ve added a bit into the post about working backwards. Thanks for that.
Proofreading touchdown? You just made my day! Thanks for this, and for Research Whisperer in general. I am probably not really your intended audience, but I get a lot of value from all the posts. You-all do good work!
[…] Research Whisperer. (2016). How to Make a Simple Gannt Chart.[online] Available at: https://theresearchwhisperer.wordpress.com/2011/09/13/gantt-chart/ [Accessed 14 Mar. […]
[…] O’Donnell, J 2011, ‘How to make a simple Gantt chart’, The Research Whisperer, 13 September, viewed 13 April 2018, < https://theresearchwhisperer.wordpress.com/2011/09/13/gantt-chart/> ;. […]
[…] you know how to make a simple Gantt […]
[…] How to make a simple Gantt chart: This article provides steps on making a Gantt chart (generally, not specific for PhD). […]
[…] “How to Make a Simple Gantt Chart,” by Jonathan O’Donnell on The Research Whisperer […]
[…] analysis of all their blog search terms. His analysis showed lots of people were looking for how to make a simple Gantt Chart. Jonathan’s excellent analysis left me wondering: what do readers think is ‘high value […]
If your university has the Microsoft suite of programs Viso (I think it is called) is easy to learn the basic functions to make a Gantt and the nice thing is that when you change a date the program moves the bars for you so fewer errors 🙂 winning.
Thanks, Wendy. Good advice.
[…] complex, messy, and not as linear as suggested by the timeline of activities we outline in project Gantt charts. During my doctorate, there were twists and turns as I made decisions around which literature to […]
[…] webinars should I register for? What about grants? Reading groups? Mentoring? How exactly does a research GANTT chart work (or does it)? How can I get research and writing done without sacrificing my entire summer on […]
[…] my various projects. This method was originally inspired by two academic Gantt chart enthusiasts (one, two). However, I found that the traditional way of setting up a gantt chart (with the projects on […]
Leave a comment Cancel reply
This site uses Akismet to reduce spam. Learn how your comment data is processed .
- Already have a WordPress.com account? Log in now.
- Subscribe Subscribed
- Copy shortlink
- Report this content
- View post in Reader
- Manage subscriptions
- Collapse this bar
We use essential cookies to make Venngage work. By clicking “Accept All Cookies”, you agree to the storing of cookies on your device to enhance site navigation, analyze site usage, and assist in our marketing efforts.
Manage Cookies
Cookies and similar technologies collect certain information about how you’re using our website. Some of them are essential, and without them you wouldn’t be able to use Venngage. But others are optional, and you get to choose whether we use them or not.
Strictly Necessary Cookies
These cookies are always on, as they’re essential for making Venngage work, and making it safe. Without these cookies, services you’ve asked for can’t be provided.
Show cookie providers
- Google Login
Functionality Cookies
These cookies help us provide enhanced functionality and personalisation, and remember your settings. They may be set by us or by third party providers.
Performance Cookies
These cookies help us analyze how many people are using Venngage, where they come from and how they're using it. If you opt out of these cookies, we can’t get feedback to make Venngage better for you and all our users.
- Google Analytics
Targeting Cookies
These cookies are set by our advertising partners to track your activity and show you relevant Venngage ads on other sites as you browse the internet.
- Google Tag Manager
- Infographics
- Daily Infographics
- Popular Templates
- Accessibility
- Graphic Design
- Graphs and Charts
- Data Visualization
- Human Resources
- Beginner Guides
Blog Graphic Design 11 Gantt Chart Examples For Project Management
11 Gantt Chart Examples For Project Management
Written by: Bronwyn Kienapple May 10, 2023
Slack pings, client emails, subcontractor texts… it’s enough to drive anyone crazy. Stop the communication madness and make a Gantt chart .
A Gantt chart lets you communicate your project timeline visually in an easy-to-understand way. Everyone’s in the loop, so you can get work done faster and easier.
Want to see Gantt chart examples, plus get tips on how to create professional Gantt charts that are professional, attractive and simple to understand?
Stick around or check out our Gantt chart templates to start customizing right away.
Click to jump ahead :
- What is a Gantt Chart?
6 Gantt chart examples
Why is a gantt chart important, what is a gantt chart used for.
- How Gantt charts improve team communication, project tracking & time management ?
Benefits of using a Gantt chart
What are the parts of a gantt chart, how to make a gantt chart, what is a gantt chart.
A Gantt chart is a timeline of a project. The top of the chart shows the time frame and the left side of the chart lists the project activities.
Here’s a Gantt chart example:
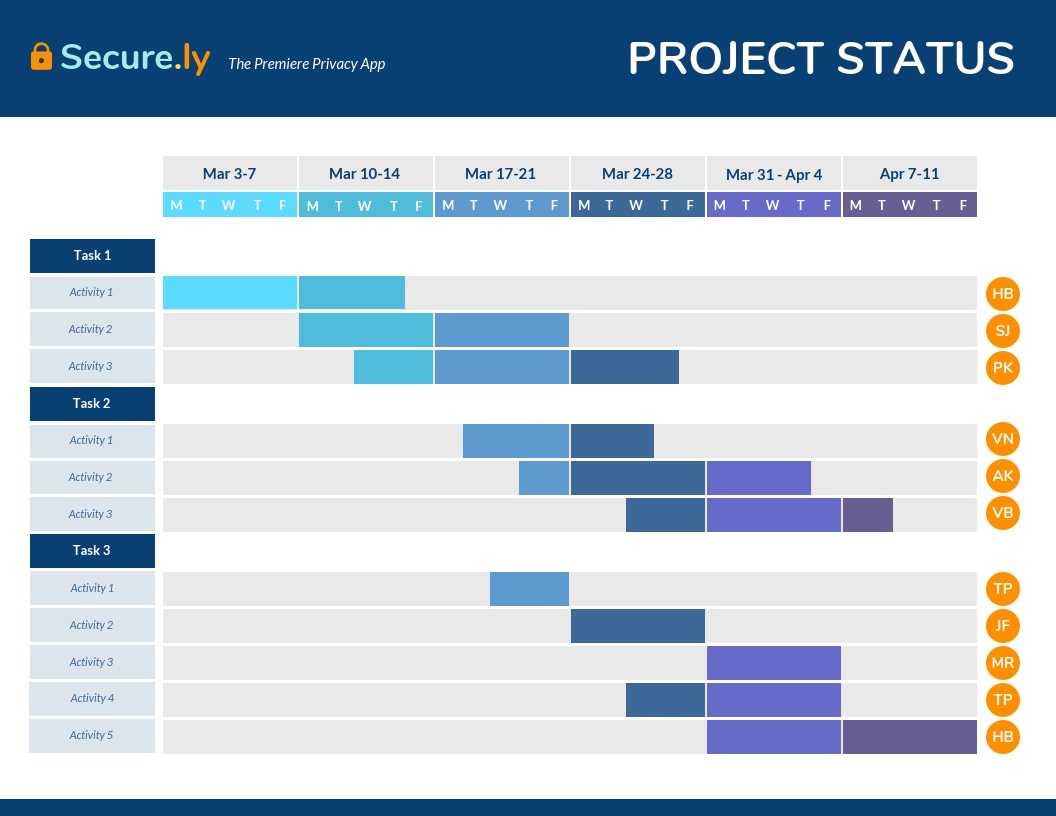
Each activity listed on the left-hand side of a Gantt chart has a colored bar next to it.
The position and length of that bar depends on the activity’s timeline and duration: when it starts and when it ends.
- For example, in the daily project status Gantt chart above, Activity 1 (Task 1) will take place from March 3 to 7 and then from March 10 to 13. The due date is Thursday of that week. Each week is color coded.
Here’s another example:

In short, a Gantt chart shows:
- What tasks need to be done to complete the project
- When these tasks need to be done
Now that you know what a Gantt chart is, let’s look at a few examples to better understand its usability and versatility.
- Gantt charts for Project Management
- Gantt Charts for Construction
- Gantt Chart Example for Project Proposals
- Gantt Chart Example for Business Plans
- Gantt Chart Example for Consultants
- Gantt Chart Example for Manufacturing
1. Gantt charts for project management

Gantt charts can be a helpful visual to include in project management plans .
Like the previous example, this retro daily project Gantt chart example breaks down project activities day by day.
It also breaks down who’s responsible for what project activity.
- Sonya J. is responsible for it from September 3 to 14 (two weeks).
- Amir K. is responsible for it from September 17 to 21 (one week). Julia F. is in charge of Task 1/Activity 1 from September 17 to October 2. Her red bar shows that the due date is Wednesday.
The magic of a Gantt chart is that it lets you set the order in which tasks should be completed.
And since Gantt charts are in an easy-to-understand timeline format, the task order is crystal clear.
Your team and/or clients won’t need to ask you again and again when Mark is supposed to be working on link building. Phew .
Project management: simplified.
This template would work especially well for consultants , as the client can get a visual representation of the team working on their project.
Putting faces to the names creates confidence in the client and helps build your reputation.
Pro Tip : Use Venngage’s collaboration features to add team members (like your client) to your account and share your Gantt chart seamlessly. Or better yet, edit and customize your gantt charts with your team in real time with our new real-time collaboration feature!
Get feedback and approvals faster within one channel, without having to juggle Slack messages, emails, or G Suite comments.
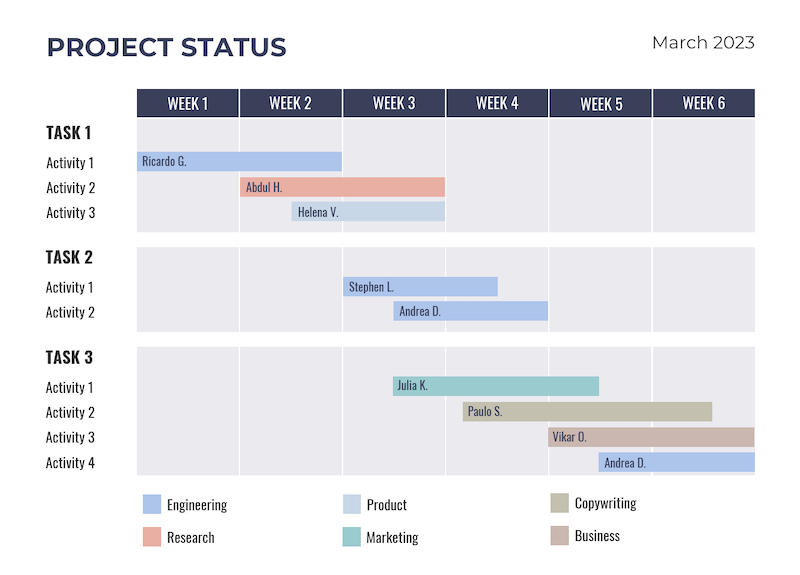
This corporate weekly project Gantt chart example is more traditional than the previous example. The focus is on the activities and their types, not the individual people.
The types of activities, such as engineering or marketing, are color coded.
- For example, Task 3/Activity 1 is a marketing activity that will take place from the middle of week 3 to the middle of week 5. Julia K. is responsible for this activity.
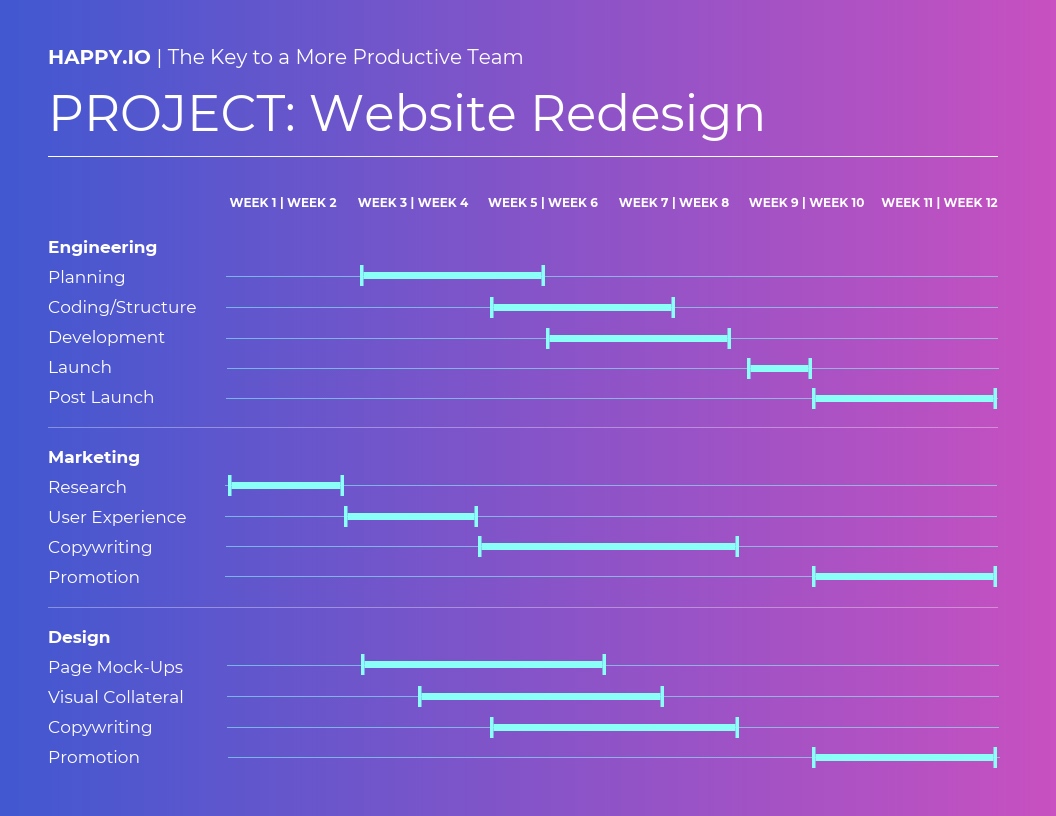
This futuristic-looking Gantt chart example is perfect for teams who operate on the sprint system .
The template is divided into two-week sprints, but you can change this to a one week sprint (or longer) as needed.
The left hand side is divided by team and further divided by activity.
- For example, the engineering team will do planning from the beginning of week 3 to the end of week 5.
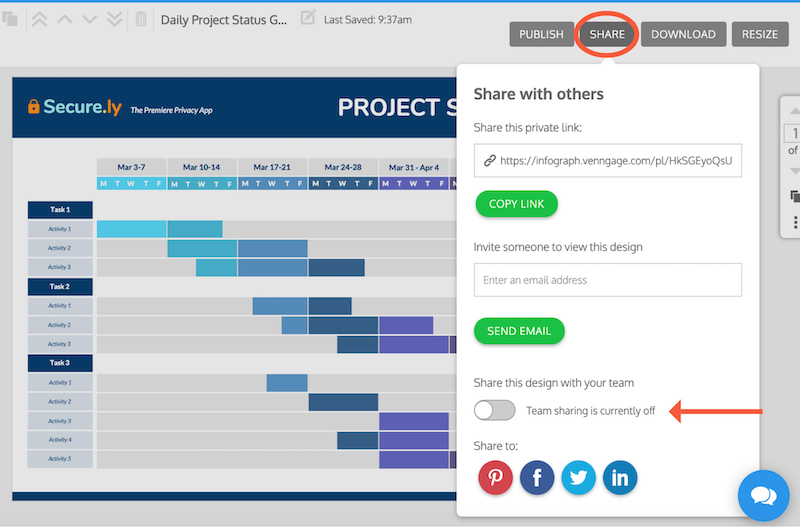
Pro Tip : When you’ve finished editing your Gantt chart in Venngage, click “Share” in the top right corner of the editor to email or get a link to your design.
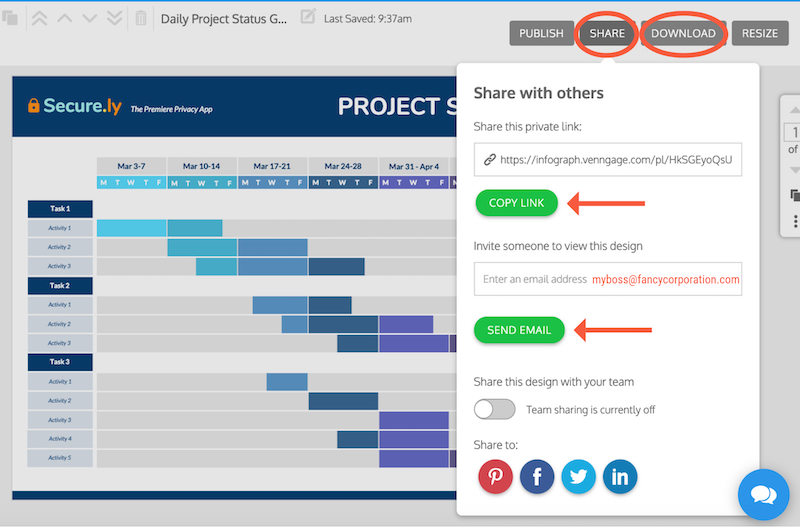
Or click “Download” to download a PDF or PNG file to your hard drive (Premium and Business plans only).
Add your Gantt chart to your weekly team meeting presentation . Consultants can add them to their proposals or work plan templates or integrate them into their project management tool .
2. Gantt Charts for Construction
Construction projects can suffer from “too many cooks in the kitchen” syndrome, making it really hard to meet deadlines.
Gantt charts are a great way to keep construction projects on schedule and make sure clients, crew members and subcontractors are in the loop.
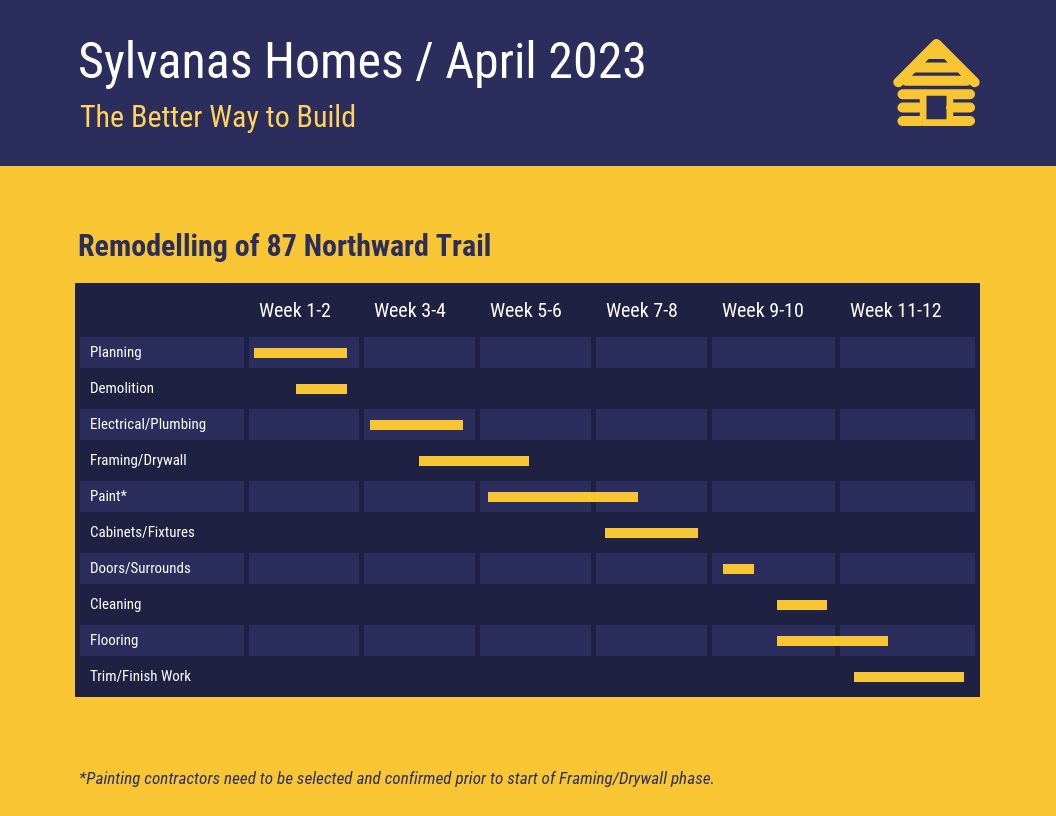
This construction project Gantt chart example will make sure everyone’s on the same page. The chart’s simple format makes it easy to see what activity is due when .
You can edit the Gantt chart as the project progresses.
- For example, if an activity is taking longer than it should, extend the bar’s length and make that section red. That way, everyone is instantly aware of overtime and potential project delays.
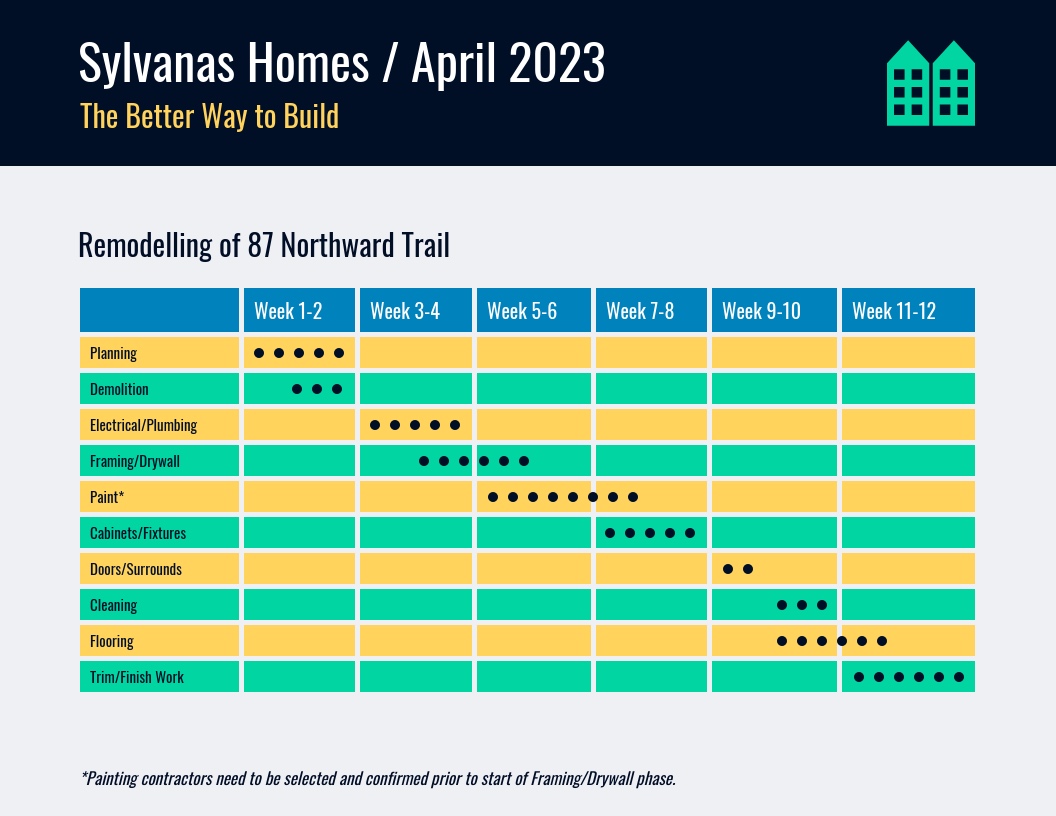
This construction project Gantt chart example is almost the same format as the previous one, but the dots represent two day intervals.
- For example, demolition will run from Friday of week 1 to Friday of week 2 (six days).
Pro Tip : Venngage’s My Brand Kit tool lets you apply your brand colors to your Gantt chart template with one click. My Brand Kit also lets you include your logo and apply brand fonts.
For example, in the above template, using My Brand Kit would change the blue, yellow and green background color scheme to your brand’s color scheme. You can then click “shuffle” to cycle through the color combination options.
3. Gantt Chart Example for Project Proposals
New product in the works? Use this dark new product project Gantt chart example.
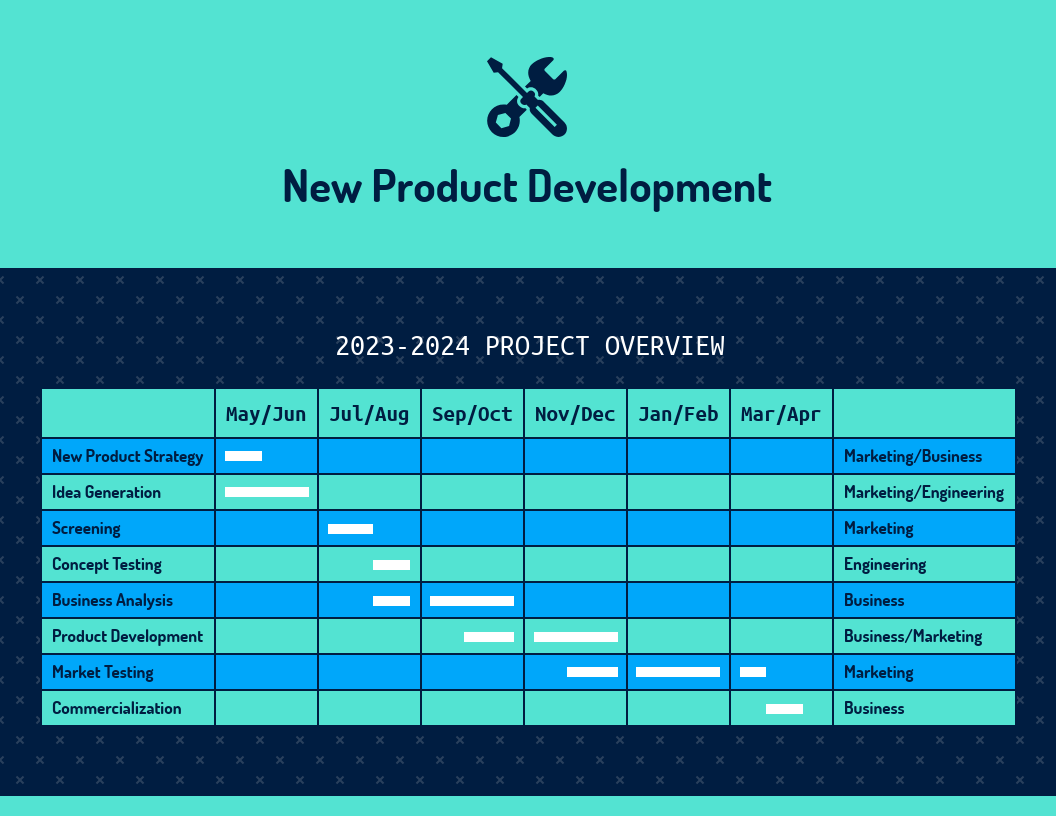
The far left hand column maps out the activities, while the far right column lists what department is responsible for each activity.
Product development typically involves multiple departments or teams of people. There may be no one project leader, or only multiple managers, on multiple teams.
A Gantt chart is the perfect way to manage tasks between multiple teams as all the information is in one place, in a crystal-clear format.
It eliminates confusion about dependencies i.e. who needs to finish what before another team can begin their task.
Pro Tip : You can also include the chart in your business report or presentation . Download your finished Gantt chart as a PNG file (Premium and Business plans only). Choose a presentation template from our library. Once you’re in the editor, click the “Image Upload” tab to upload the Gantt chart and add it to your slides.
4. Gantt Chart Example for Business Plans
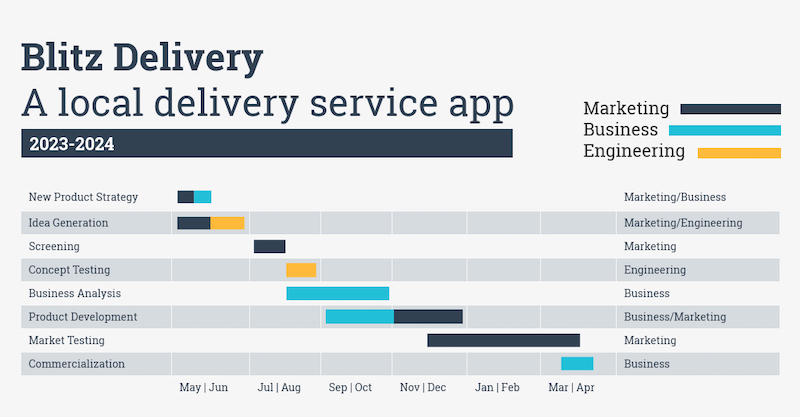
A business plan tends to contain a lot of information and can quickly become overwhelming to potential investors.
Visualizing schedules, research or data will help break up all the text and quickly communicate key deliverables.
Investors need to see that you have a concrete plan in place that will let you achieve your revenue goals.
One strategy is to use a Gantt chart to visualize your business plan’s growth strategy or marketing plan .
Use the Gantt chart example above to plot your business strategy and major milestones. Edit the time frame on the bottom to plot out stages by quarter–over several years, if you like.
You can also include this Gantt chart in your project plan .
5. Gantt Chart Example for Consultants
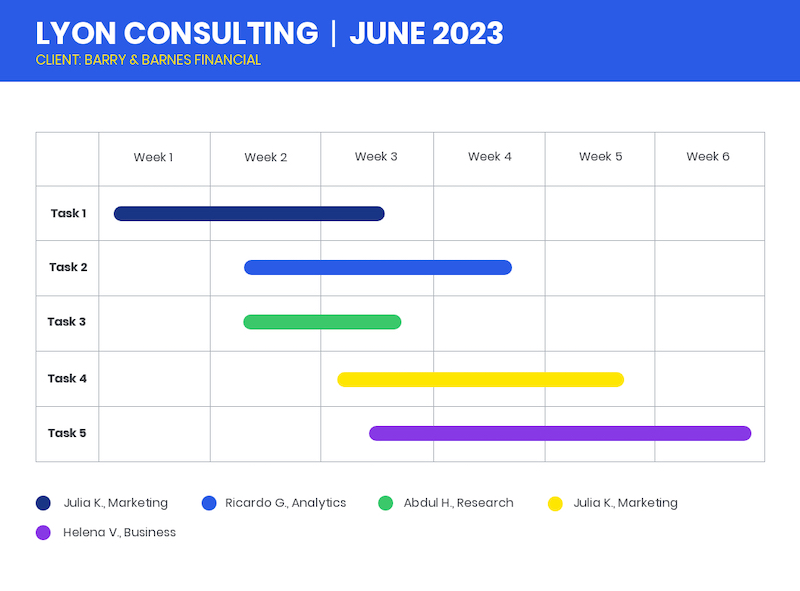
Your client’s hired you to help them achieve their goals. But, let’s say they’re a new client and they need a little more reassurance that you, the consultant, is on top of things.
Show your client that you have a workable roadmap to success with a Gantt chart.
Edit the above Gantt chart example and divide tasks–between your team, any subcontractors and your client’s team.
Refer back to the chart during your weekly calls with the client to make sure you’re both on the same page.
If you’re overwhelmed by admin work, check out our job proposal templates , business proposal templates and consulting report templates and get important documents out the door a lot faster.
Find a hard time creating business proposals fast? Read our in-depth business proposal guide to whip up proposals quickly.
They’ll also look plenty better than those Word documents you usually churn out!
Pro Tip : Love your Gantt chart’s layout and want to use it again for other consulting projects? Save it as a template in Venngage. That way, you can reuse it whenever you need to make a Gantt chart for another client.
6. Gantt Chart Example for Manufacturing
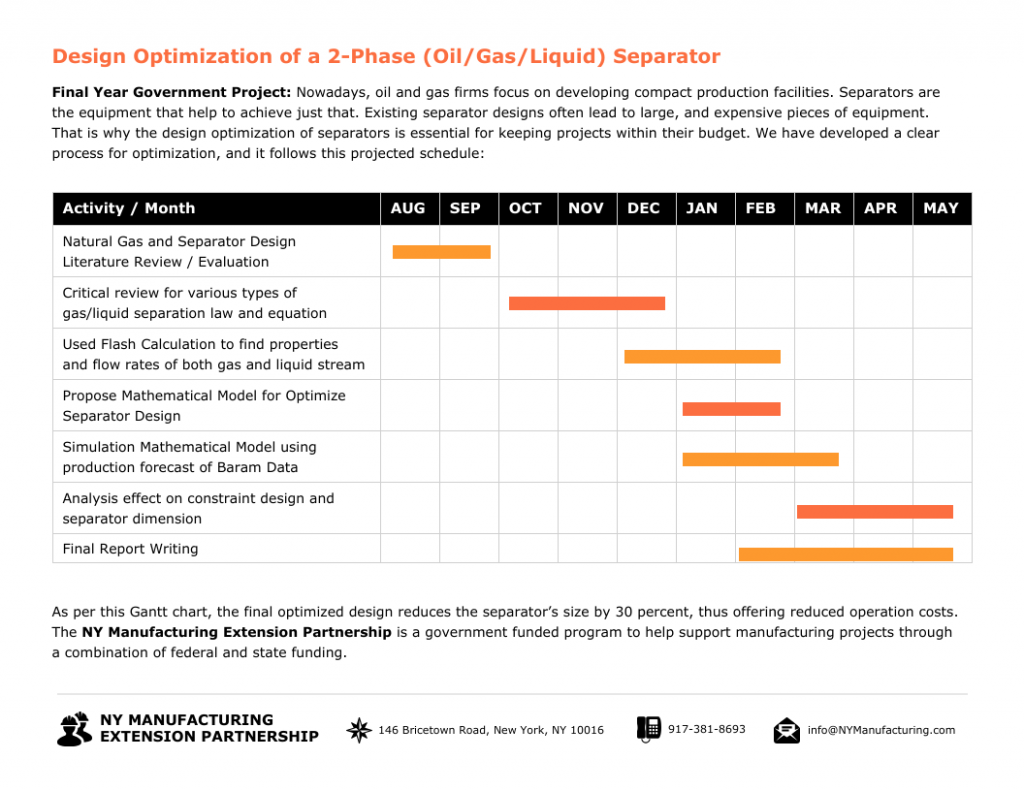
A Gantt chart template for manufacturing is useful for both employees and management. It clearly maps out the entire production process in a visual format, detailing each step from raw materials to the final product. This clarity allows your employees to see exactly what needs to be done and when, making it easier to coordinate efforts and maintain smooth operations.
Management teams benefit by being able to quickly identify potential delays and adjust plans accordingly to keep the project on track. A Gantt chart ensures everyone is on the same page, enhances productivity, and guarantees timely delivery of products.
Pro Tip: Customize your Gantt chart template to include color codes for different stages of the production process. This visual differentiation can help team members quickly understand the status of various tasks and prioritize their efforts more effectively.
Gantt charts are important because they make scheduling, planning and executing on projects easier. They also help a lot with general time management .
Projects often involve multiple stakeholders, activities and deadlines. Gantt charts visualize all these factors so that project managers and their teams can quickly understand who needs to do what and when .
This will help make sure each deliverable is completed on time.
Which in turn will prevent a snowball effect of missed deadlines, causing the project price to go up and the completion date to be pushed back.
And no one wants that.
A Gantt chart is a handy visual tool that’s great for project management, helping to lay out a project schedule. Here’s how it helps:
- Plan and Schedule Projects : By outlining tasks, how long they’ll take, and how they depend on each other, Gantt charts make planning and scheduling projects of any size much easier.
- Track Progress : They give you a clear visual of project progress, showing which tasks are done, which are in progress, and which haven’t started yet.
- Visualize Dependencies : The chart highlights how tasks depend on each other, making it easy to see how a delay in one task might affect others.
- Identify Critical Path : Gantt charts help you figure out the critical path of a project—the sequence of tasks that must be completed on time for the project to stay on schedule.
- Facilitate Communication : They serve as a centralized communication tool, providing everyone with a clear overview of the project timeline and who’s responsible for what.
Gantt charts are super useful for keeping projects organized, on track, and ensuring everyone on the team is on the same page.
How Gantt charts improve team communication, project tracking & time management?
Gantt charts are useful tools that can boost team communication, project tracking, and time management. Here’s how:
Improved Team Communication:
- Clear Visualization: Gantt charts give you a visual overview of the entire project, showing the timeline, tasks, and milestones. This makes it easy for everyone to understand their responsibilities.
- Centralized Information: All the details about the project, like who is doing what and when it’s due, are in one place. This cuts down on unnecessary back-and-forth communication.
- Status Updates: Everyone can see the status of each task at a glance, which helps in identifying any delays and facilitates timely discussions.
- Collaborative Planning: These charts make it easy to plan tasks together and adjust them as needed, ensuring that everyone is aligned.
Enhanced Project Tracking:
- Real-Time Monitoring: You can track the progress of the project in real-time, making sure everything is on schedule.
- Milestones and Deadlines: Key dates are clearly marked, helping to keep the project on track.
- Dependency Management: Gantt charts show how tasks depend on each other, so you can see how delays in one task might affect the overall timeline.
- Progress Updates: Regular updates give you a clear picture of which tasks are completed and which are still pending.
Better Time Management:
- Task Allocation: These charts help in assigning tasks efficiently, making it clear who is responsible for what and when.
- Prioritization: They help in prioritizing tasks based on their importance and deadlines.
- Resource Management: Gantt charts highlight resource bottlenecks, ensuring optimal use of resources.
- Forecasting: Teams can predict future workload and adjust plans to prevent team members from being overburdened.
Practical Example: Imagine you’re running a marketing campaign. A Gantt chart can help you:
- Schedule Tasks: Plan out content creation, design, social media posts, and ad placements.
- Assign Responsibilities: Clearly assign tasks and set deadlines for each team member.
- Track Progress: Visually update the status of each task to see what’s completed and what’s still in progress.
- Manage Dependencies: Make sure that content is ready before starting the design phase.
- Adjust Plans: Modify tasks as needed to stay on track for the campaign launch date.
Gantt charts provide a clear and visual way to manage projects. They improve team communication, project tracking, and time management, leading to more successful project outcomes.
The benefits of a Gantt chart include:
- Scheduling and planning projects and tasks
- Plan work in sprints
- Visualizing how projects and tasks evolve over time
- Collaborate with your team
- Comparing planned versus actual timelines
Gantt charts are incredibly versatile — they’re useful for multiple roles, such as:
- Project managers
- Marketing managers
- Team leaders
- Operations managers
- Consultants
Gantt charts aren’t industry-specific, either. They’re a critical tool for anyone managing a long-term project that has lots of tasks and a complex schedule and that requires collaboration.
- For example, the Gantt chart example below can be adapted for any project simply by changing the tasks and milestones:

Industries that can benefit from Gantt charts include:
- Construction
- Manufacturing
- Product development
- Engineering
- Infrastructure
- Oil and gas
- Telecommunications
- Professional services and consultants
Telecommuting has risen 140 percent since 2005, according to Globa l Workplace Analytics .
As this number continues to skyrocket, a Gantt chart becomes even more critical for team management and to effectively plan and track work as a team.
When you first look at a Gantt chart, it might seem overwhelming.
What do the bars or lines mean? How do they relate to the x and y axes?
But, on second glance you’ll see that the beauty of a Gantt chart is actually in its simplicity.
A Gantt chart only has three main parts:
- Activities and/or tasks (left axis)
- Milestones (top or bottom axis)
- Activity and/or task bars
Take a look at this simple Gantt chart example:
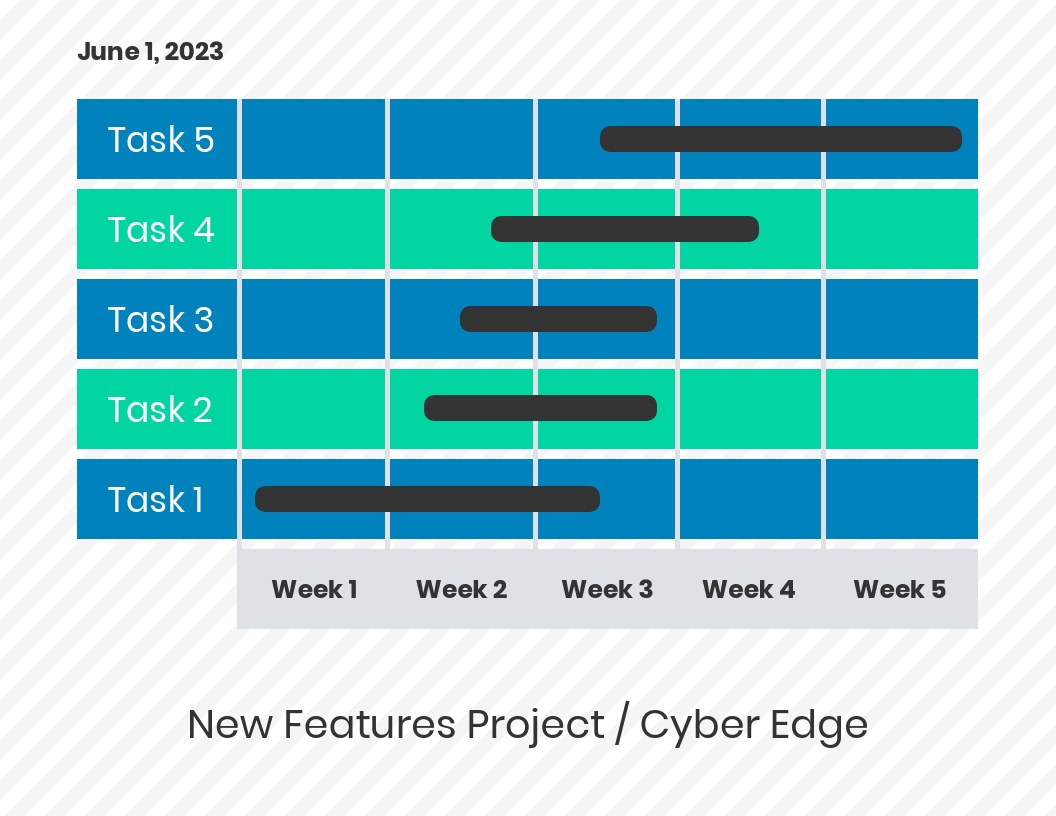
Not intimidating at all.
- Tasks on the left axis
- Milestones on the bottom axis
- And bars that show when each task should begin and end
Of course, more complex projects, such as the construction of large urban infrastructures or complex software engineering services, require more complex Gantt charts.
The Gantt chart example below takes things a step further by dividing activities into smaller tasks.
- For example, “Planning” is divided into: needs assessment, project agreement and site map.
This Gantt chart also lists (on the right) who’s responsible for each task.
The good news is that you can now create a Gantt chart with Venngage in five steps:
1. Choose a Template
Choices, choices. Open our Gantt chart templates gallery .
Then, select the template for you by:
- Ex. Dark Home Construction Project Gantt Chart Template
- Ex. Dark New Product Project Gantt Chart Template
- Corporate Weekly Project Gantt Chart
- Ex. Detailed Project Gantt Chart
Hover over the template you like and click “Create.”
2. Lay Out Your Timeline From Left to Right
Start by laying out the timeline of your from left to right, creating divisions by day, week, month, or quarter.
In this Gantt chart template, click the text box you want to edit and start typing.
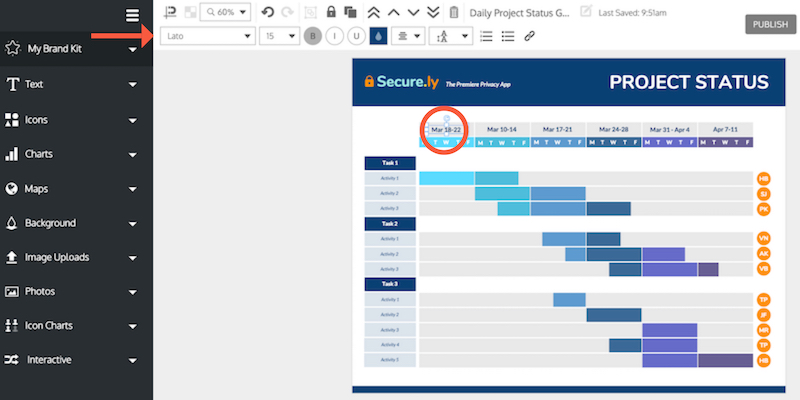
Or delete the days of the week and add months or quarters, instead.
Made a mistake? You can click “undo” in the top toolbar at any time.
To add a new column to the right, click “Resize” and increase the width of the custom page size. Try adding 200 more pixels and readjust as needed.
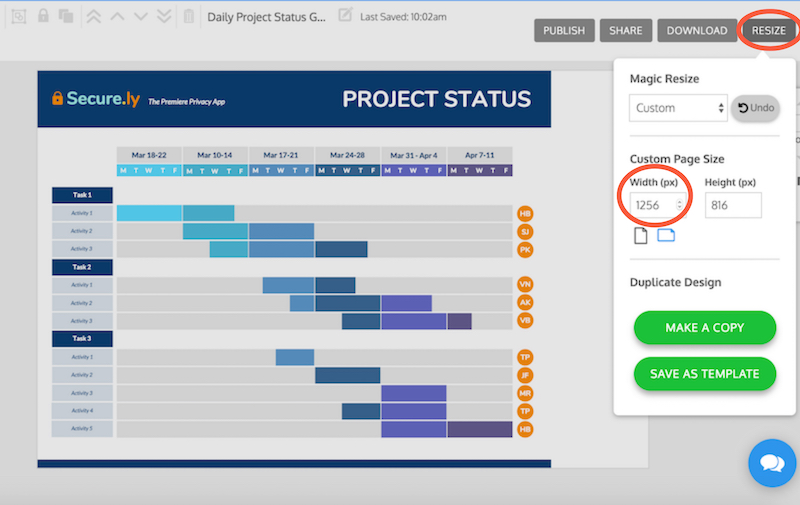
Then, drag and select all the orange icons to move them to the right at the same time.
Drag to select the entire dates section and click “copy” and move into place. Edit the dates.
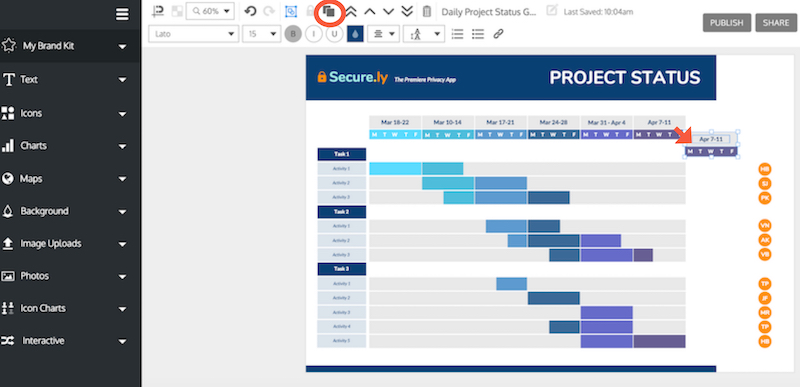
Now, drag to extend the beige bars. Use the “snap to guide” feature to help you align everything perfectly.

3. Add Tasks From Top to Bottom
Click the tasks and activities to edit the text. Use the top navigation bar to change the font style, size, color etc.
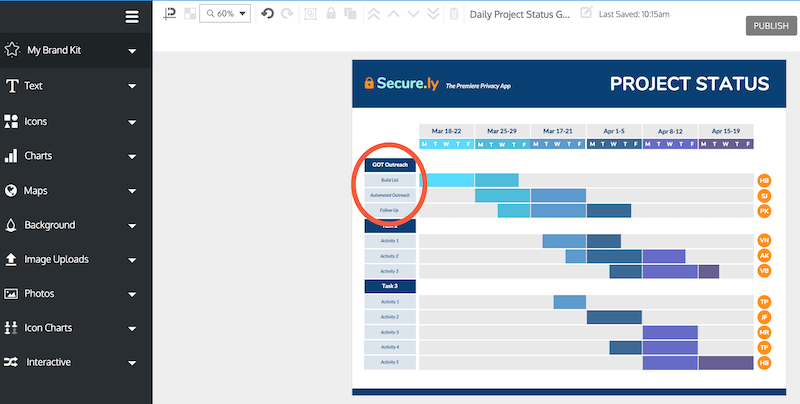
If you need to add a new row, follow the same steps for adding a new column as above. Just adjust the height of the page size instead of the width. Then, copy the last row by dragging to select and pressing “copy.”
4. Adjust Each Bar Accordingly
Adjust each bar so it begins at the task’s start date and extend it to the end of the expected task deadline.
Click each bar to move it or drag it. The snap-to-guide feature will help you align the bar with the specific day of the week above.
Copy other bars with the right color and move them into place to extend the timeline of a task.
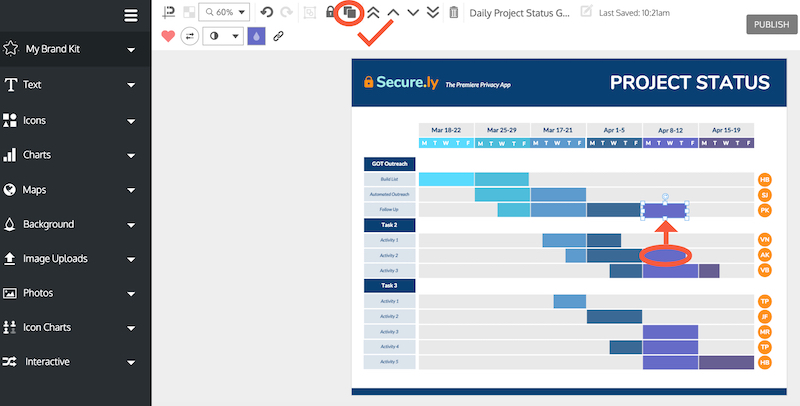
You can also click the orange circles to assign each task to a different person–in the above Gantt chart template they’re indicated by initials.
5. Brand Your Gantt Chart
Brand your Gantt chart with one click by opening the My Brand Kit tab. Drag your logo into place.
Then, click a “My Brand Colors” palette to apply these colors to the entire template. Click “Shuffle” to scroll through different color combinations. Very cool.
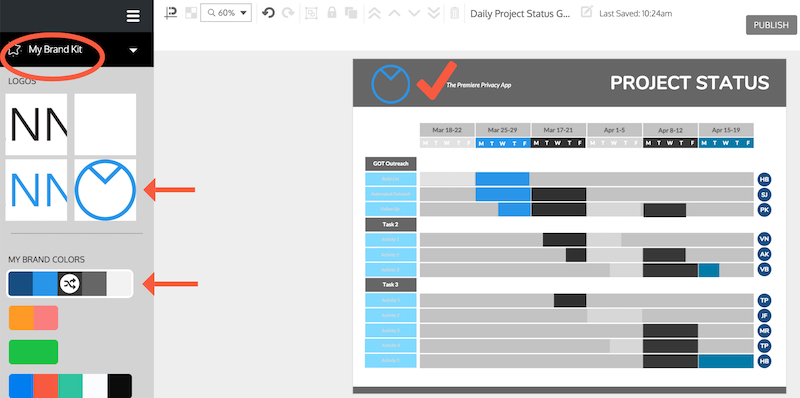
Want a different type of design? Discover even more Gantt chart templates .
Pro Tip : Struggling to customize your Gantt chart just the way you want it? Venngage offers priority support via email, chat and phone and 1-on-1 consultations to Business plan members. Ask our designers for tips on how to present your idea visually — whether in a Gantt chart or a presentation, report, white paper etc.
What’s your number one struggle with managing projects right now? Let us know in the comments below!
You might also enjoy:
20+ Stunning Consulting Proposal Templates That Will Convert Prospects to Clients
20+ Page-Turning White Paper Examples [Design Guide + White Paper Templates]
Discover popular designs

Infographic maker

Brochure maker

White paper online

Newsletter creator

Flyer maker

Timeline maker

Letterhead maker

Mind map maker

Ebook maker
Gantt Chart Examples, Templates, and Styles
By Diana Ramos | October 31, 2022
- Share on Facebook
- Share on LinkedIn
Link copied
Gantt charts are the bread and butter of project scheduling. We’ve assembled dozens of example images and templates to help you make the best Gantt charts possible.
Included on this page, you’ll find 30 downloadable Gantt charts, with helpful examples for marketing , software development , project management , product development , and human resources . Plus, read expert tips on making Gantt charts for various formats , including Google Sheets, Excel, Microsoft Word, and more.
What Does a Gantt Chart Look Like?
A Gantt chart is a simple bar chart that shows all the tasks, events, and milestones in a project. The x-axis depicts the project timeline, and the y-axis depicts project phases. Each horizontal bar represents a project task.
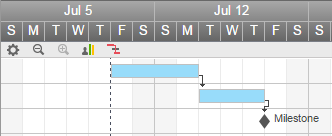
In most Gantt charts, the current date is represented by a vertical line, which looks like a progress bar.
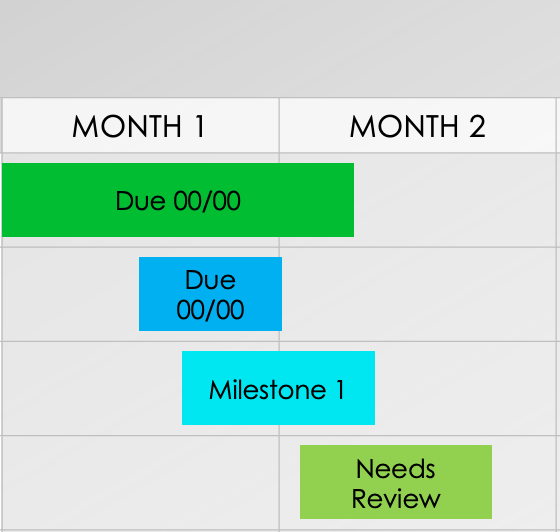
Other common symbols are diamonds or stars, which represent milestones.
Many Gantt charts use color-coding to separate project phases.

“When creating a Gantt chart, each task is represented by a bar that extends over the duration of the task,” says Danny Trichter, Co-Founder of AccessibilityChecker.org . “The length of the bar indicates the duration of the task, and the placement of the bar indicates when the task will begin and end. In addition, Gantt charts often include information such as task dependencies, milestones, and resources.”
For some projects, especially those with tight deadlines, it can be helpful to include project dependencies in your chart. These are typically represented with arrows. You can use arrows to distinguish between the four types of dependencies: finish-to-start, start-to-start, finish-to-finish, and start-to-finish.
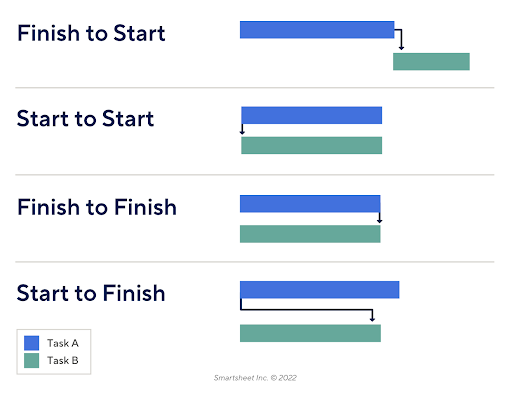
You can also use Gantt charts to represent lead time, lag time, predecessor tasks, and successor tasks when necessary.

“Gantt charts should be created in a way that is easy to read and understand. I believe if it's not simple, people won't use it,” says Chad Sibila , Sales Manager at VT Industries. “I really like to see a left-to-right, start-to-finish for one project, with the steps to complete along the way.”
For more detailed information about making and using Gantt charts for your upcoming projects, see this basic Gantt chart guide with how-to videos.
Gantt Chart Examples by Format
The format you choose for your Gantt chart depends on the type of project, accessibility needs, and preference. For example, if your team conducts most of their work in Microsoft Suite, then PowerPoint, Excel, and Microsoft Word are better options.
Gantt charts are popular because they are easy to use and adaptable. You can create them in any spreadsheet, word processing, or presentation software. For projects where collaboration and access are key, Google formats such as Google Docs and Google Sheets are the most useful.

Jan Schiller, Partner and Chief Project Officer at Berkshire Consulting, LLC , recommends that you select a tool that can create a Gantt chart from source data, such as Excel or Google Sheets. “The Gantt chart can be lifted into any format that is meaningful to stakeholders,” she explains. “I recommend using one format consistently. Why? For information integrity and transparency that supports informed decision-making. Seamlessly switching between source data and the Gantt chart improves trust and credibility while greatly reducing the effort of maintaining an accurate Gantt chart.”
Gantt Chart Example Template for Excel
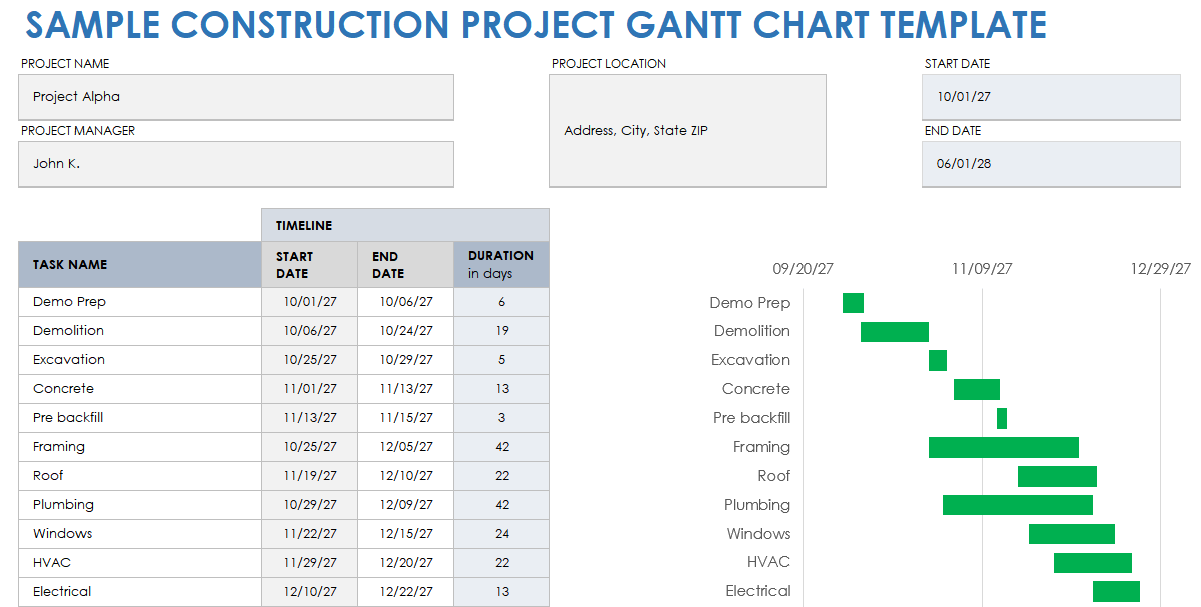
Download the Sample Construction Project Gantt Chart Template for Excel Download the Blank Construction Project Gantt Chart Template for Excel
Microsoft Excel is a popular software for creating and designing Gantt charts. For example, streamlined formulas allow you to keep all of your data in a centralized location, while generating Gantt charts automatically. Download the sample or blank template to see an example Gantt chart in Excel for a new home construction project.
“I prefer using Excel for creating Gantt charts because it is easy to use and provides a lot of flexibility,” says Trichter. “I can easily add more information, such as task dependencies, milestones, and resources. Also, I can easily format the chart to make it look more professional.”
Find a how-to video, a step-by-step guide, and helpful tips for creating your own Gantt chart with this comprehensive guide to creating Gantt charts in Excel .
Gantt Chart Example Template for PowerPoint
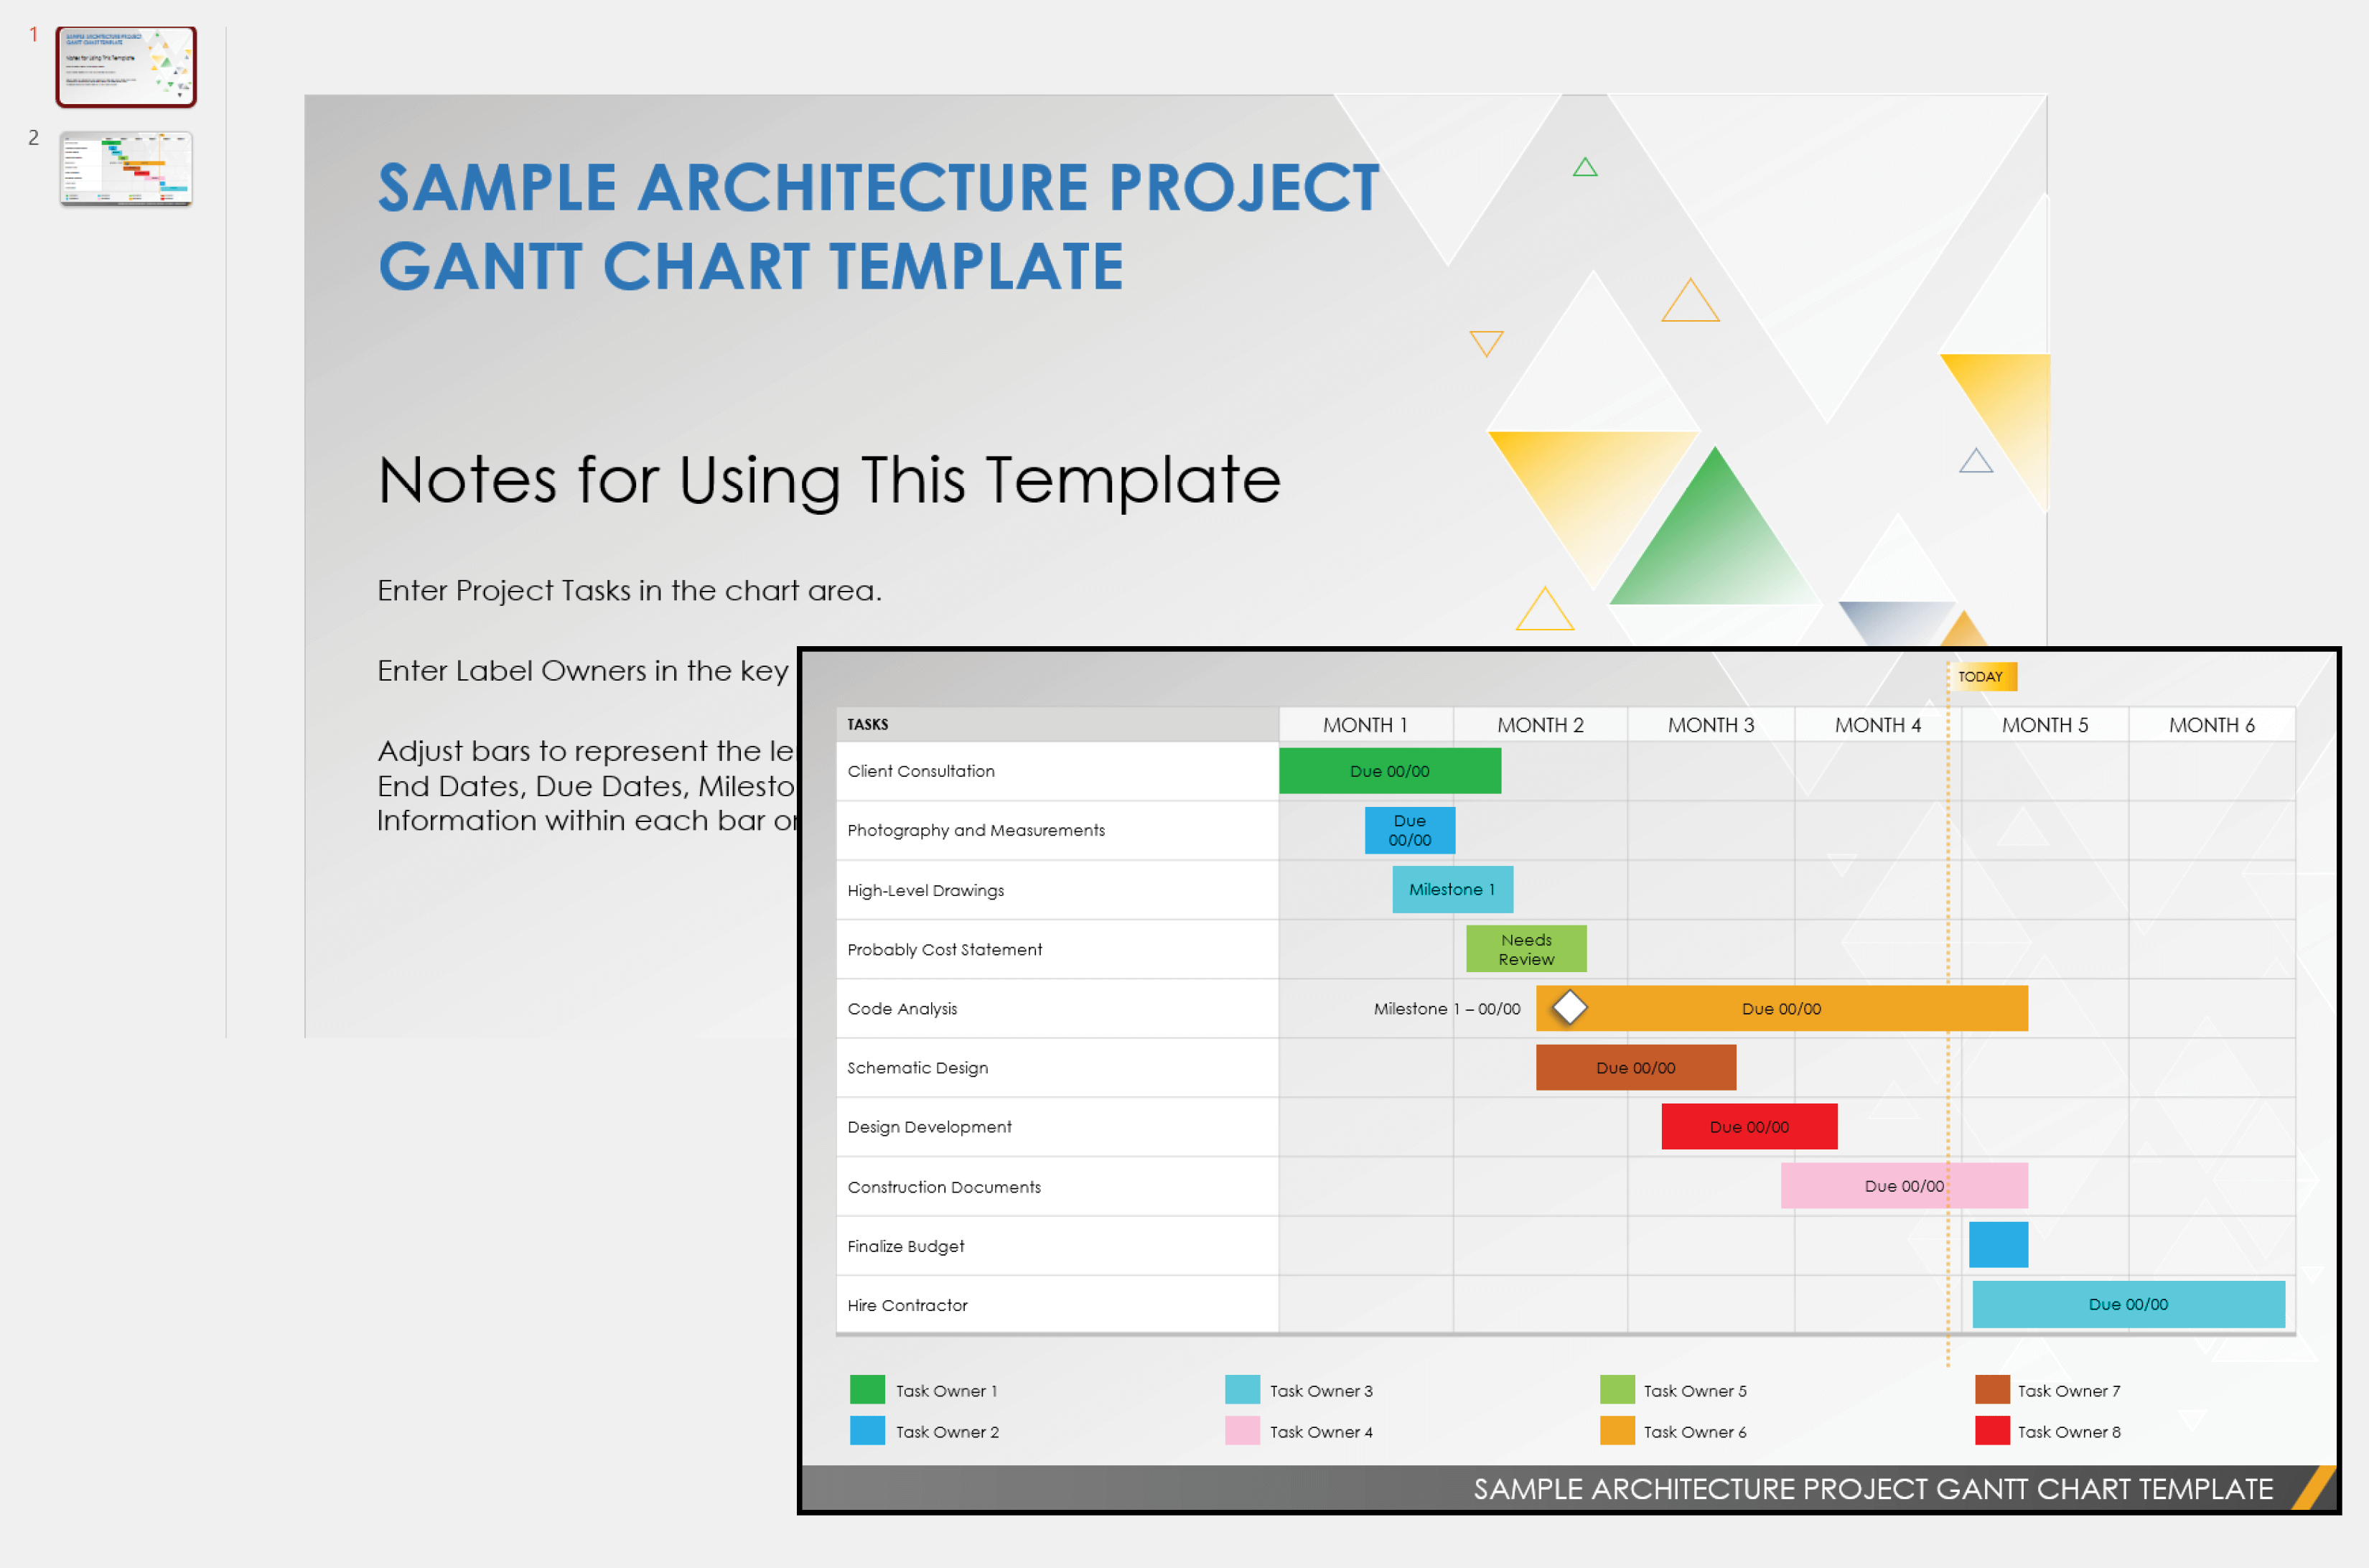
Download the Sample Architecture Project Gantt Chart Template for PowerPoint Download the Blank Architecture Project Gantt Chart Template for PowerPoint
Download a detailed example of a Gantt chart or a blank version in PowerPoint for an architecture project. This easy-to-use Gantt chart PowerPoint is the perfect solution for anyone looking to create or present a dynamic project schedule in a presentation format.
“If I were creating a Gantt chart to share with a large group of people, I might choose to use PowerPoint so that I could include more visuals and make the chart easier to understand,” explains Trichter.
To learn how to create, import, and customize your own Gantt chart for a presentation, see this comprehensive guide to creating Gantt charts in PowerPoint .
Gantt Chart Example Template for Microsoft Word
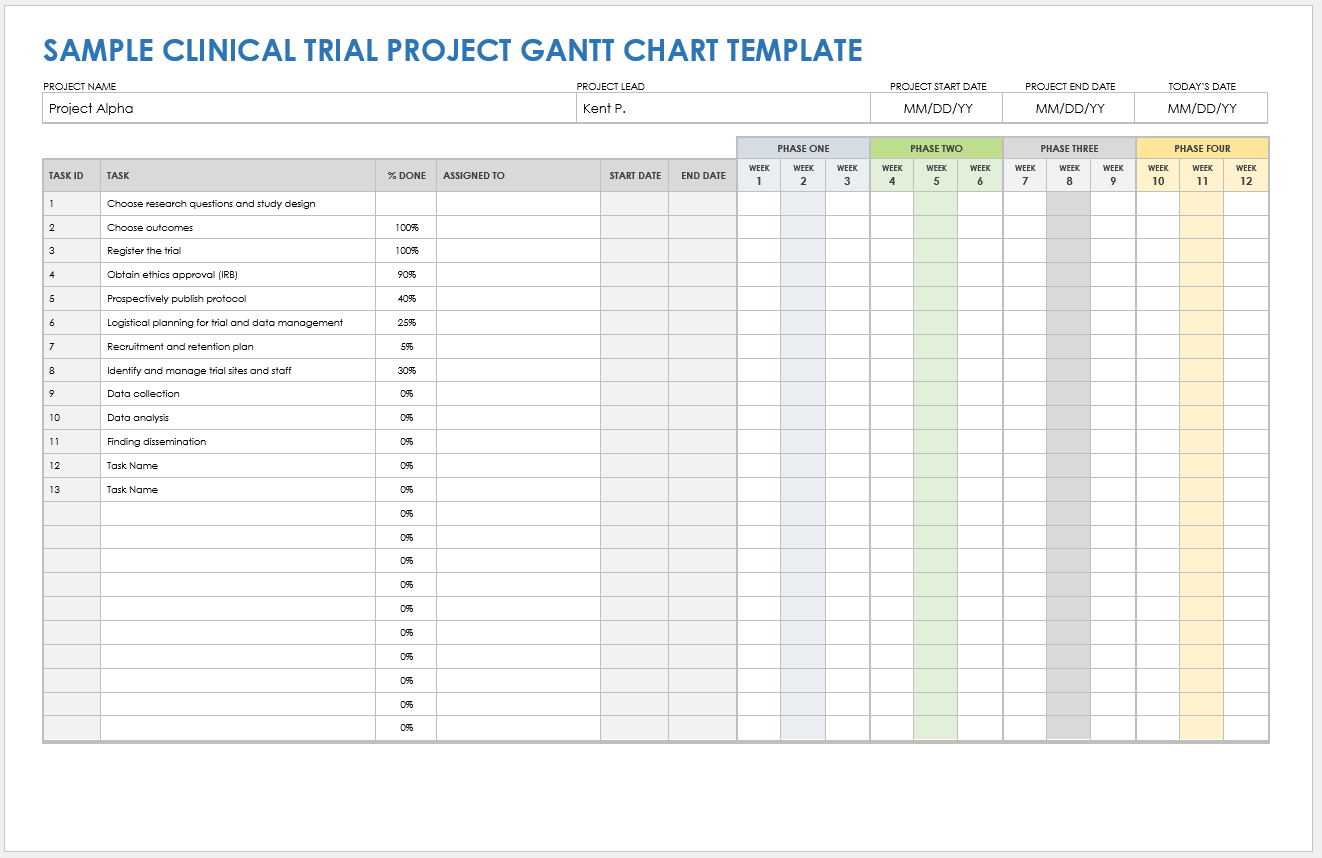
Download the Sample Clinical Trial Project Gantt Chart Template for Microsoft Word Download the Blank Clinical Trial Project Gantt Chart Template for Microsoft Word
Get started with a blank Microsoft Word template, or download the sample template for a prepared version that shows real data for a research project. In this case, the example is for a clinical trial of a new product. Microsoft Word is a great format option if you need a simple, printable Gantt chart. Use this template to track daily project tasks in a single document. Assign start and end dates, responsible team members, and statuses for each task in the chart.
“Microsoft Word and Google Docs are formats that I typically use for more static content, such as reports or articles,” says Tricther.
To learn how to make and customize a Gantt chart, use this step-by-step guide to creating Gantt charts in Microsoft Word .
Gantt Chart Example Template for Google Sheets
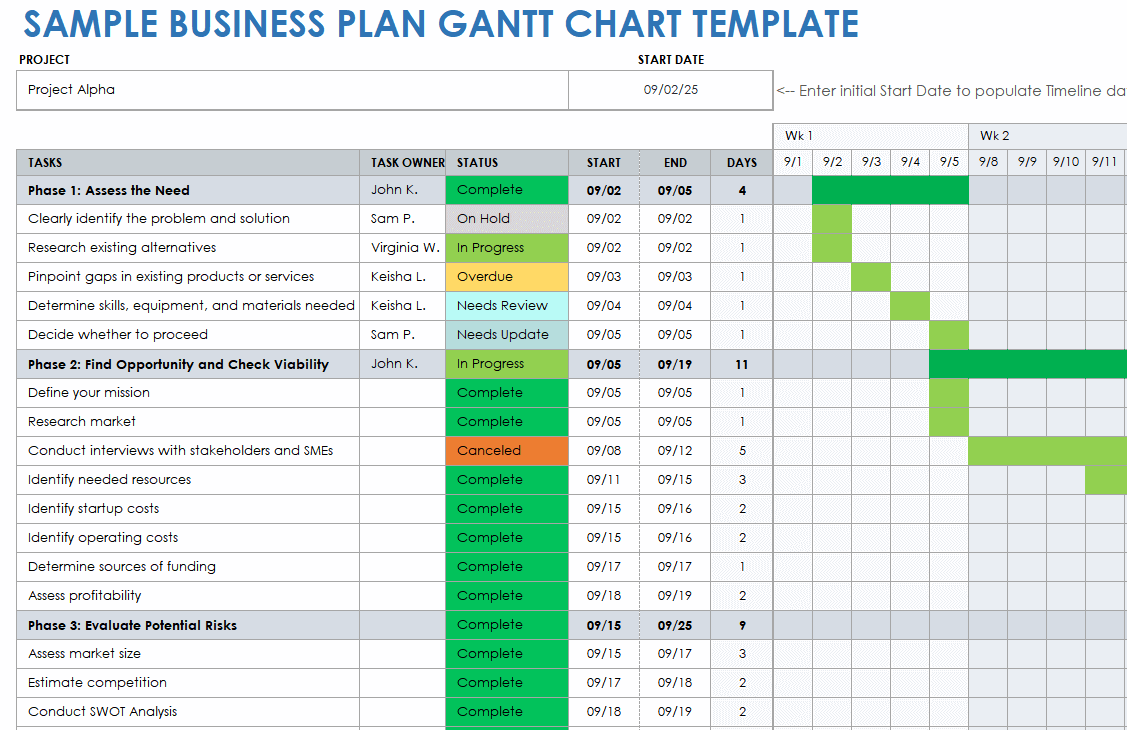
Download the Sample Business Plan Gantt Chart Template
Excel | Google Sheets
Download the Blank Business Plan Gantt Chart Template
Download the sample template in Google Sheets to see how a project manager might use a Gantt chart to make a business plan. Google Sheets is hard to beat for a collaborative, accessible option with lots of helpful formulas and features. Use this template to track every task in your project in one shareable, web-based document.
For additional templates, guides, and helpful tips, see this comprehensive article on creating a Gantt chart for Google Sheets .
Gantt Chart Example Template for Google Docs
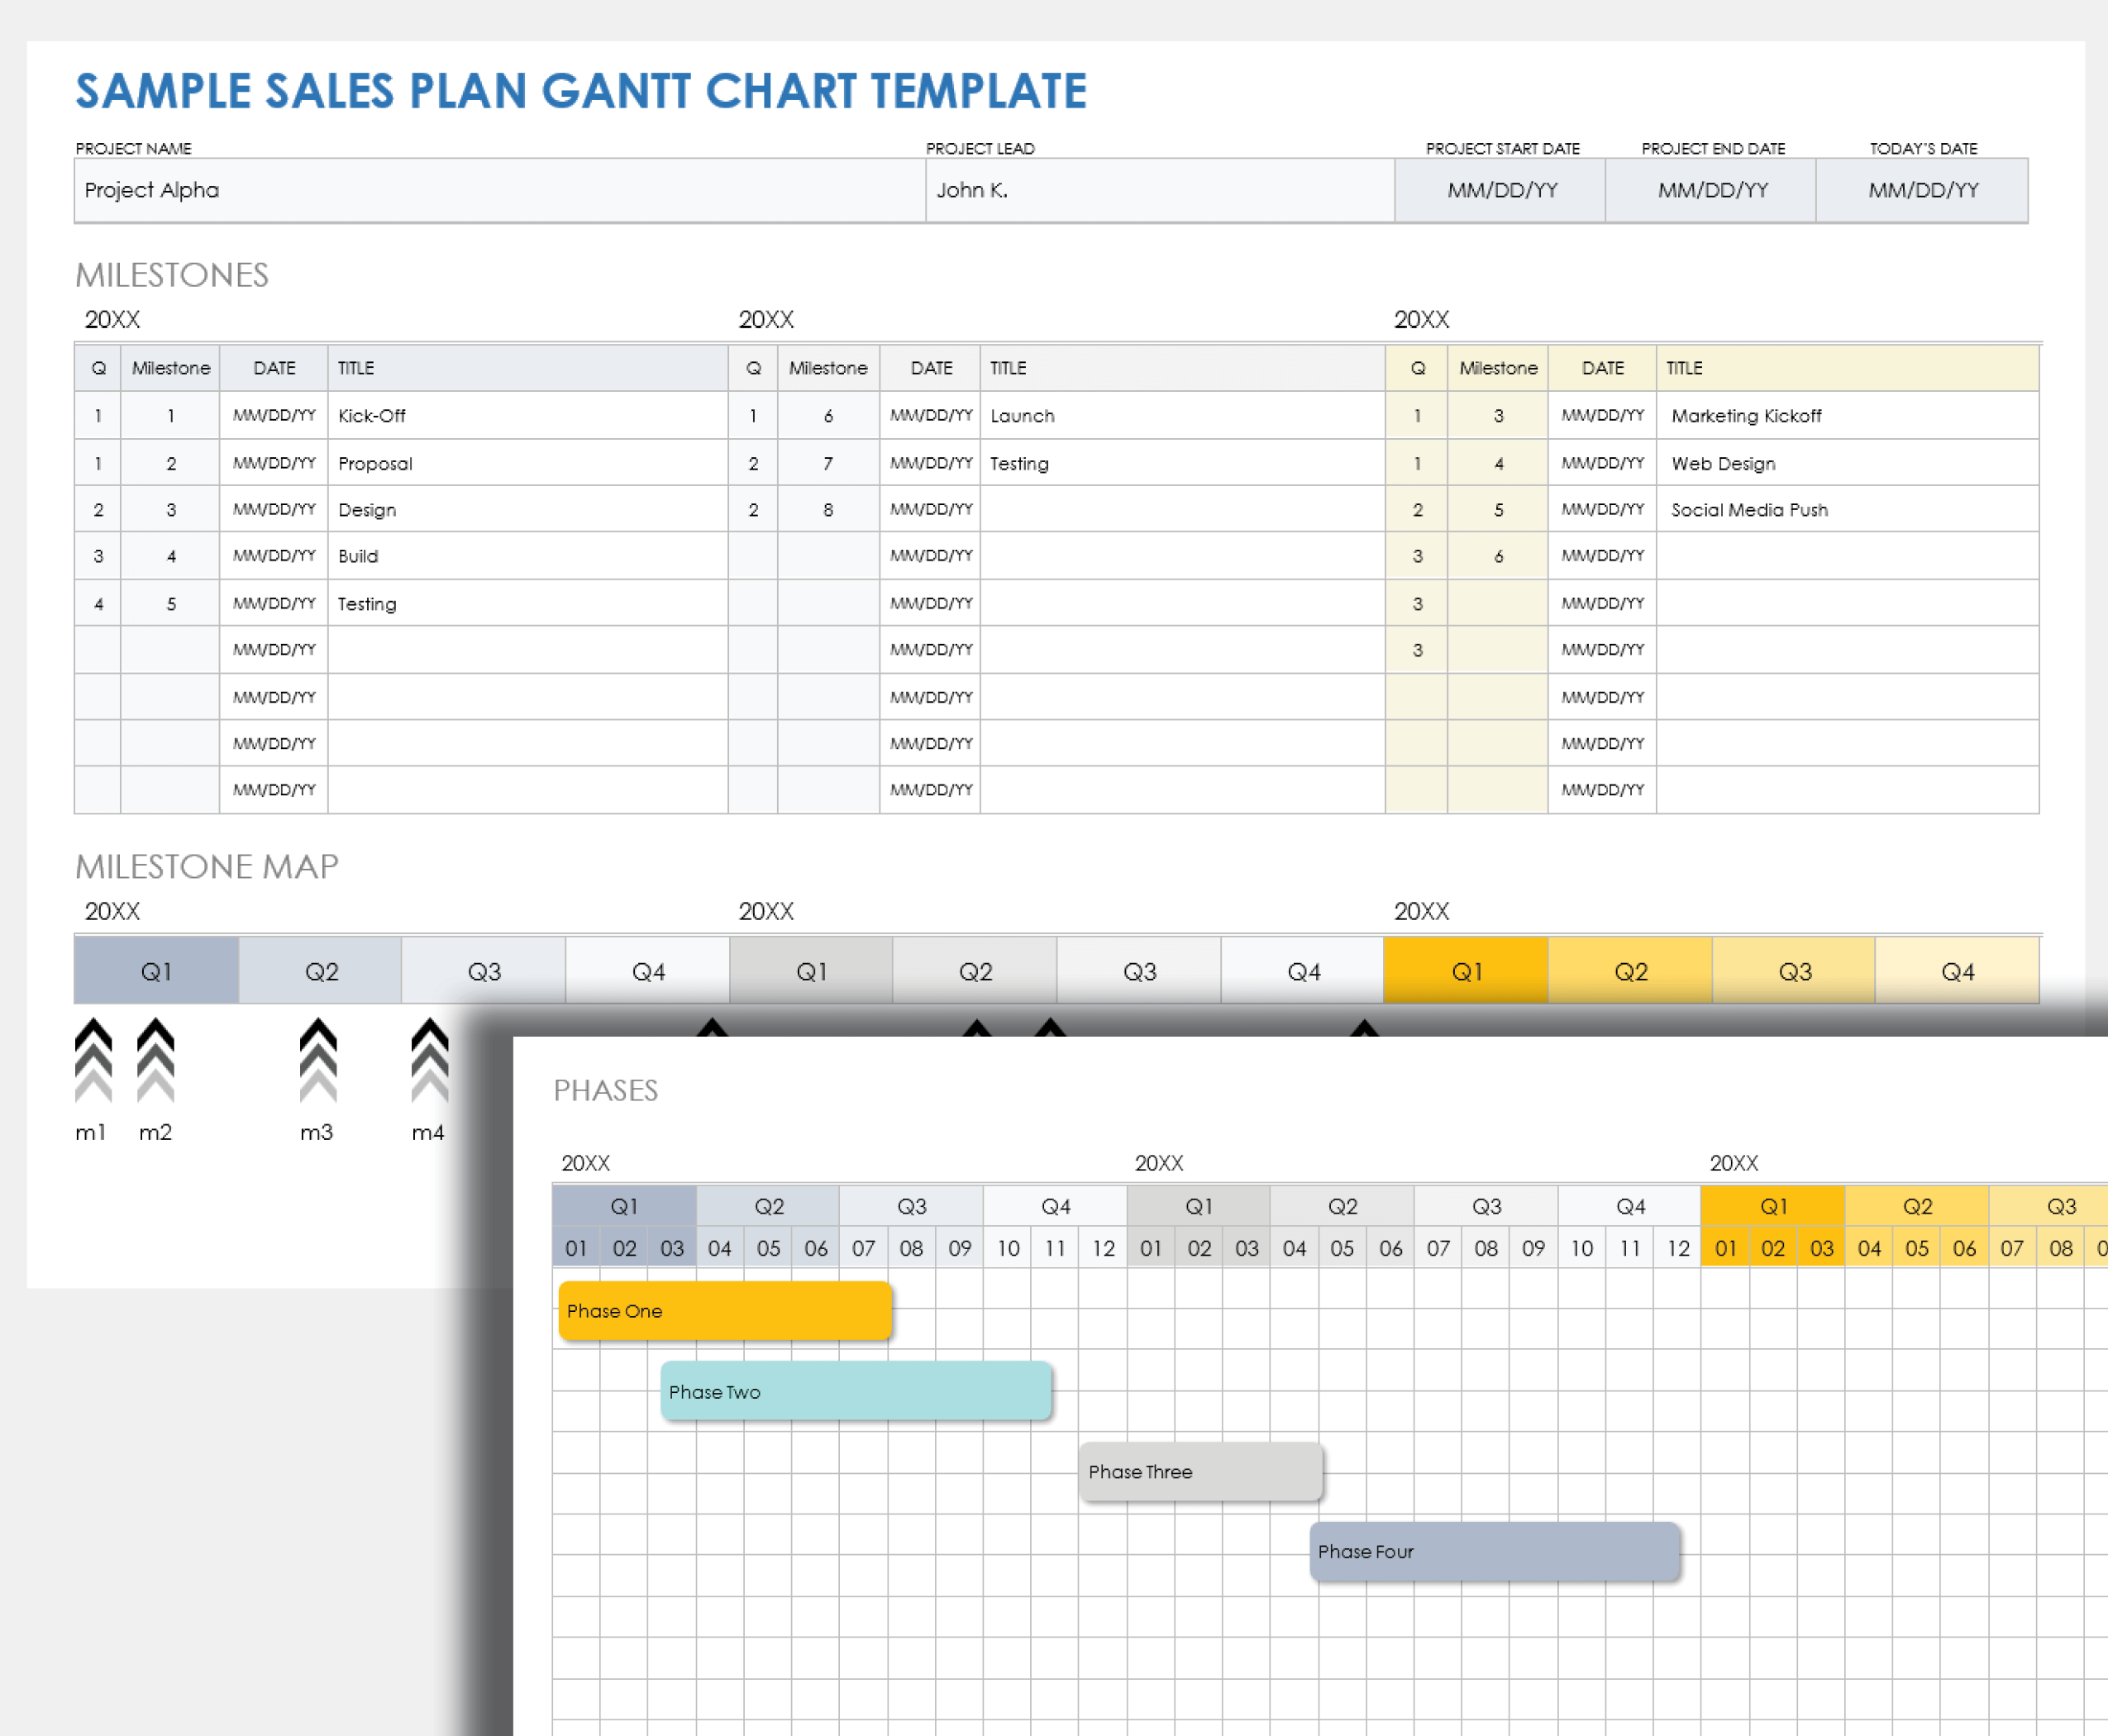
Download the Sample Sales Plan Gantt Chart Template
Microsoft Word | Google Docs
Download the Blank Sales Plan Gantt Chart Template
Google Docs is another easily shareable and printable format option for making a Gantt chart. Try this Gantt chart template to track the phases and milestones of any project. Download the sample template for a version of a Gantt chart for a sales plan.
Gantt Chart Examples for Marketing
Whether it’s a social media, print, email, or other type of marketing campaign, Gantt charts can help you account for every step along the way. We’ve gathered a helpful list of example images and templates for your next marketing project.

“I started using Gantt charts for mobile project development, as they were taking over two to three months and involving dozens of people,” says Benjamin Poirrier, Founder and CEO of the marketing agency Prodima . “Nowadays, I use them to manage smaller digital marketing campaigns with various stakeholders (developers, designers, content writers, account managers), so I can follow up on the progress of their tasks.”
Marketing Campaign Gantt Chart Example Template
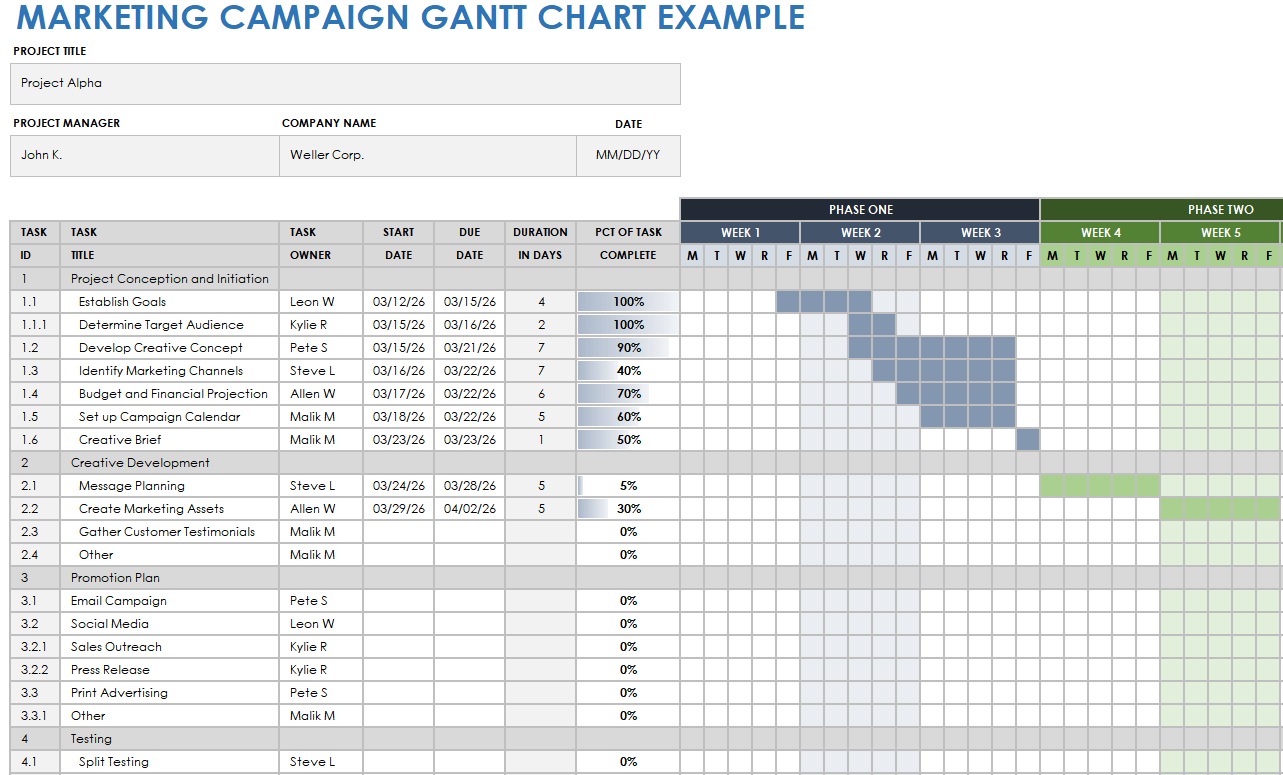
Download a Sample Marketing Campaign Gantt Chart Template for Excel | Microsoft Word
Download a Blank Marketing Campaign Gantt Chart Template for Excel | Microsoft Word
This downloadable example template provides a roadmap for a basic marketing project. From project conception and initiation to launch and measurement, this template has you covered. Assign task owners, set deadlines, and track statuses of every step in the project.
Gantt Chart Example for Market Research
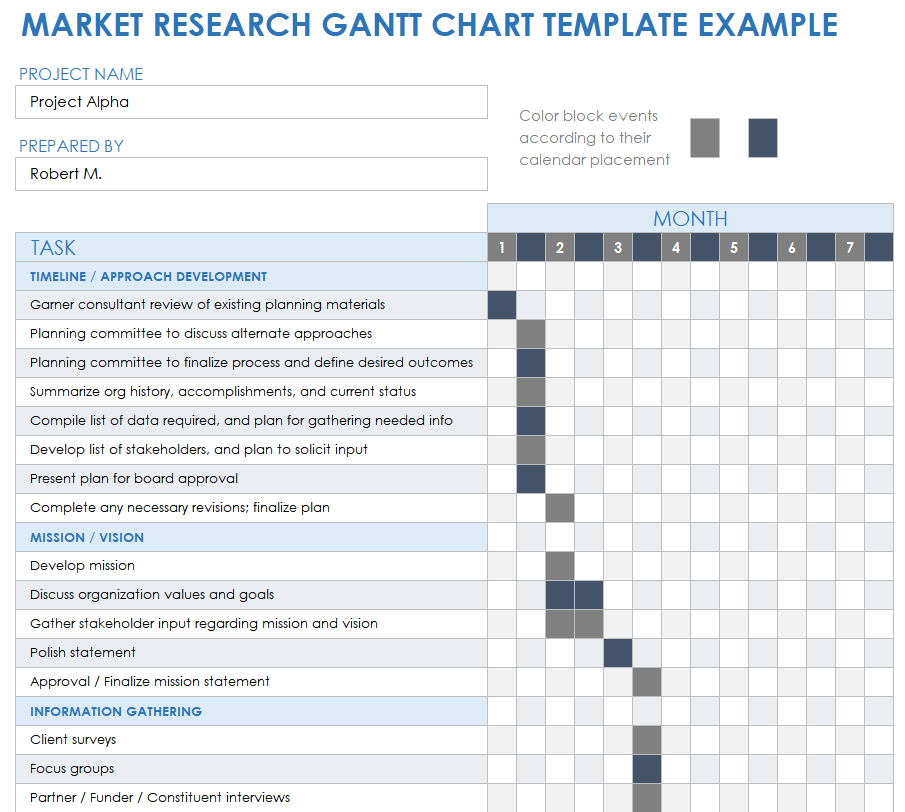
Download the Sample Market Research Gantt Chart Template for Excel Download the Blank Market Research Gantt Chart Template for Excel
Use this straightforward Gantt chart template to map all the phases of your market research project, from planning and developing a mission statement to conducting client surveys, focus groups, environmental studies, and more.
Gantt Chart Example for Video Production
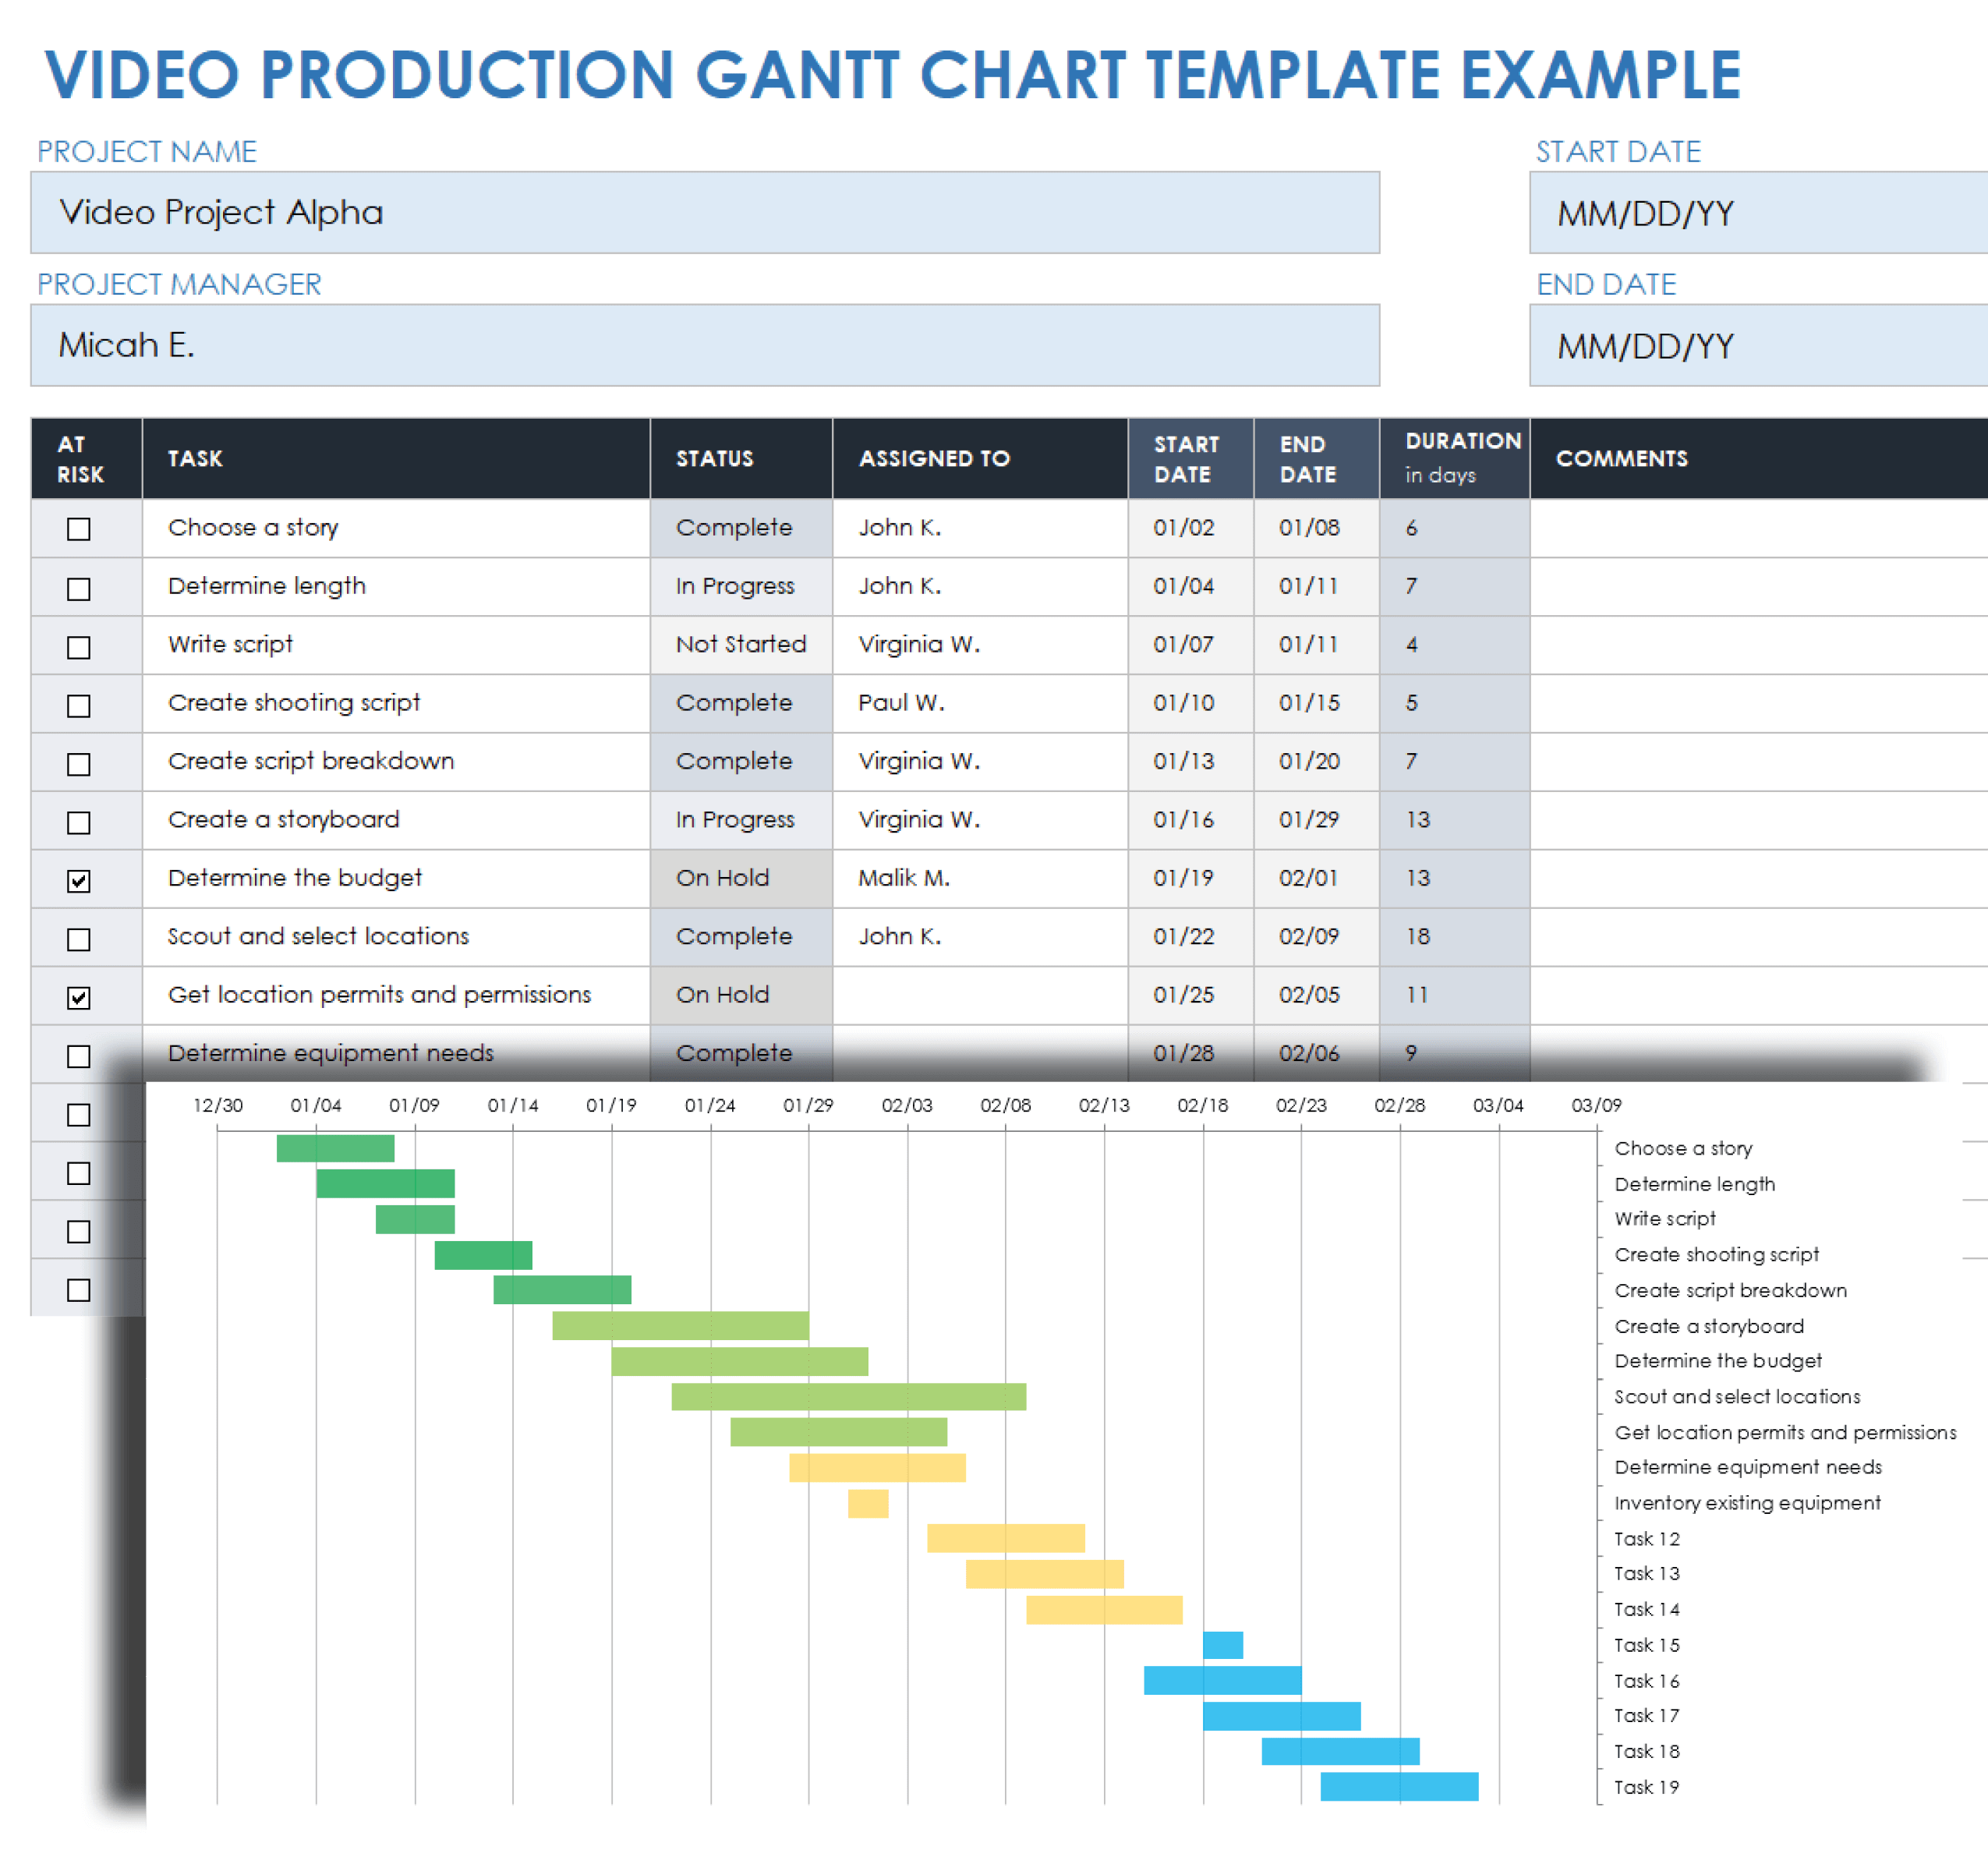
Download a Sample Video Production Gantt Chart Template for Excel | Microsoft Word
Download a Blank Video Production Gantt Chart Template for Excel for Excel | Microsoft Word
Use a Gantt chart for your next video production project to ensure that you account for all important tasks, from pre- to post-production. Download the blank template to begin mapping your project. For more guidance, try the completed template with sample text to see how someone might use a Gantt chart to schedule a video production project.
Digital Marketing Campaign Gantt Chart Example
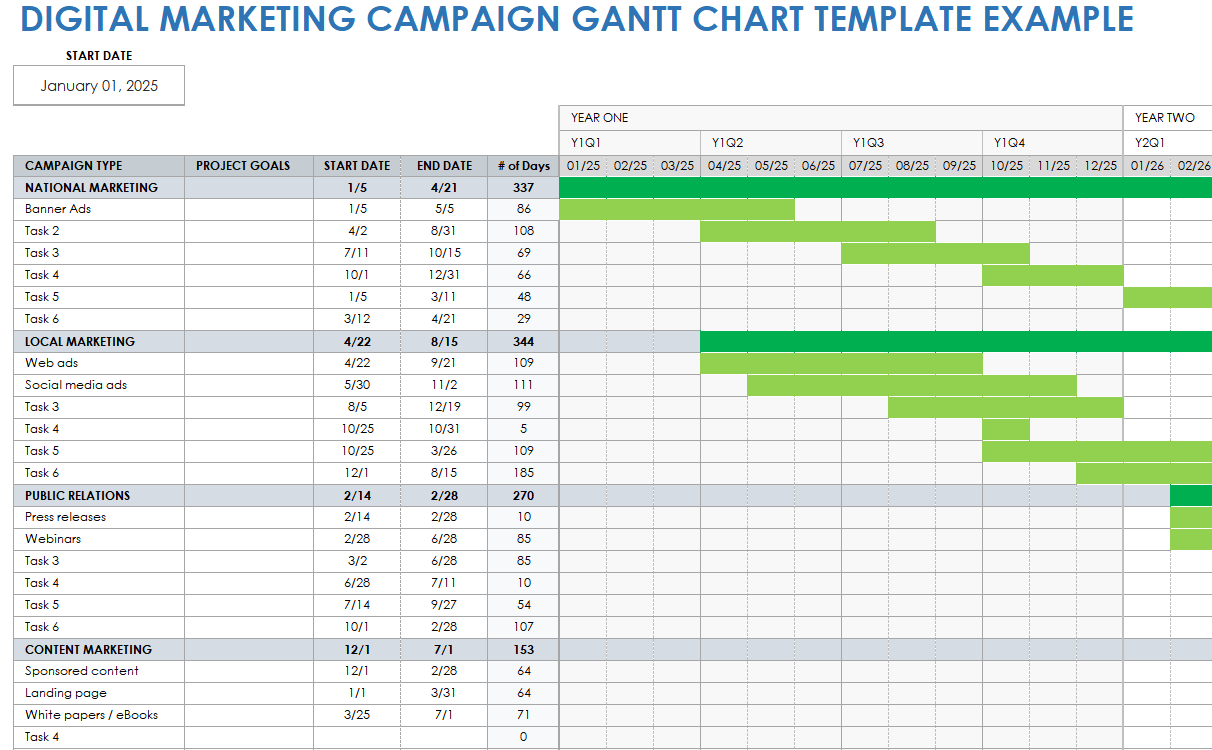
Download a Sample Digital Marketing Campaign Gantt Chart Template for Excel | Google Sheets
Download a Blank Digital Marketing Campaign Gantt Chart Template for Excel | Google Sheets
A successful digital marketing campaign can significantly expand the reach and impact of your brand or product. Use this template to monitor the various components of a digital marketing campaign. Track the timelines of your local marketing, content marketing, social media, web, and sales campaigns all in one convenient Gantt chart.
Example Gantt Chart for an Email Marketing Campaign
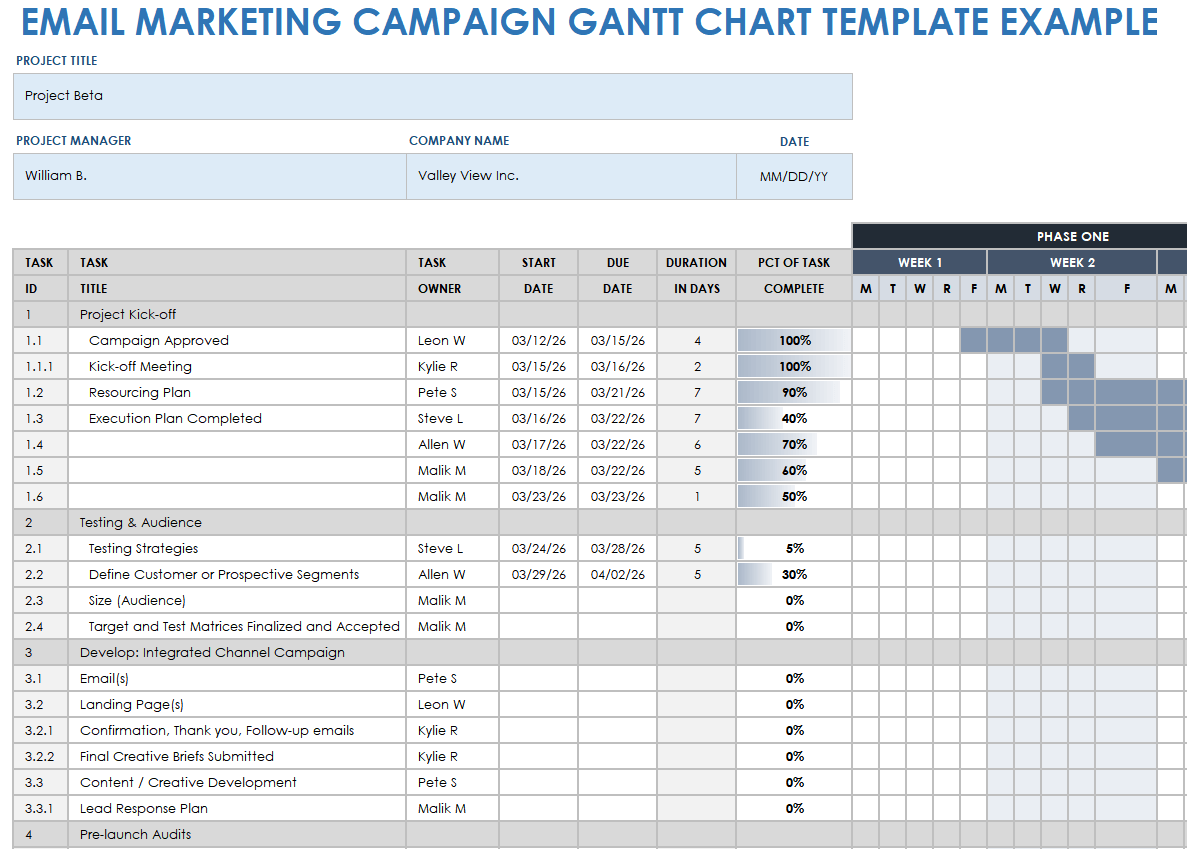
Download a Sample Email Marketing Campaign Gantt Chart Template for Excel | Google Sheets
Download a Blank Email Marketing Campaign Gantt Chart Template for Excel | Google Sheets
Email marketing campaigns are an effective way to inform existing and potential customers of upcoming sales, events, initiatives, and more. Follow the steps and phases in the customizable sample Gantt chart template for an example of how to effectively design, write, review, and release an email marketing campaign. Download the blank Gantt chart template to start from scratch.
Social Media Campaign Gantt Chart Example
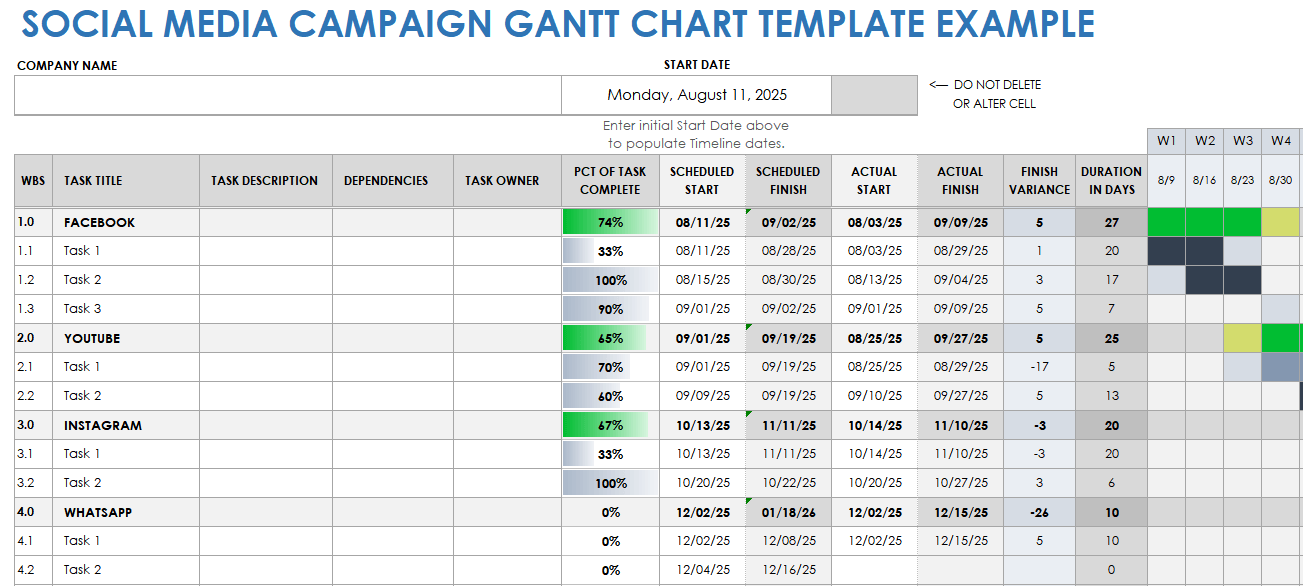
Download a Sample Social Media Campaign Gantt Chart Template for Excel | Google Sheets
Download a Blank Social Media Campaign Gantt Chart Template for Excel | Google Sheets
Use a Gantt chart to streamline your multiplatform social media campaign to ensure that posts are consistently on-brand, timely, and polished. In this example, the chart separates tasks by platform making it easy for your team to give the appropriate amount of attention to each advertisement, whether it’s on Facebook, Instagram, TikTok, Snapchat, or another platform.
Virtual Event Planning Gantt Chart Example
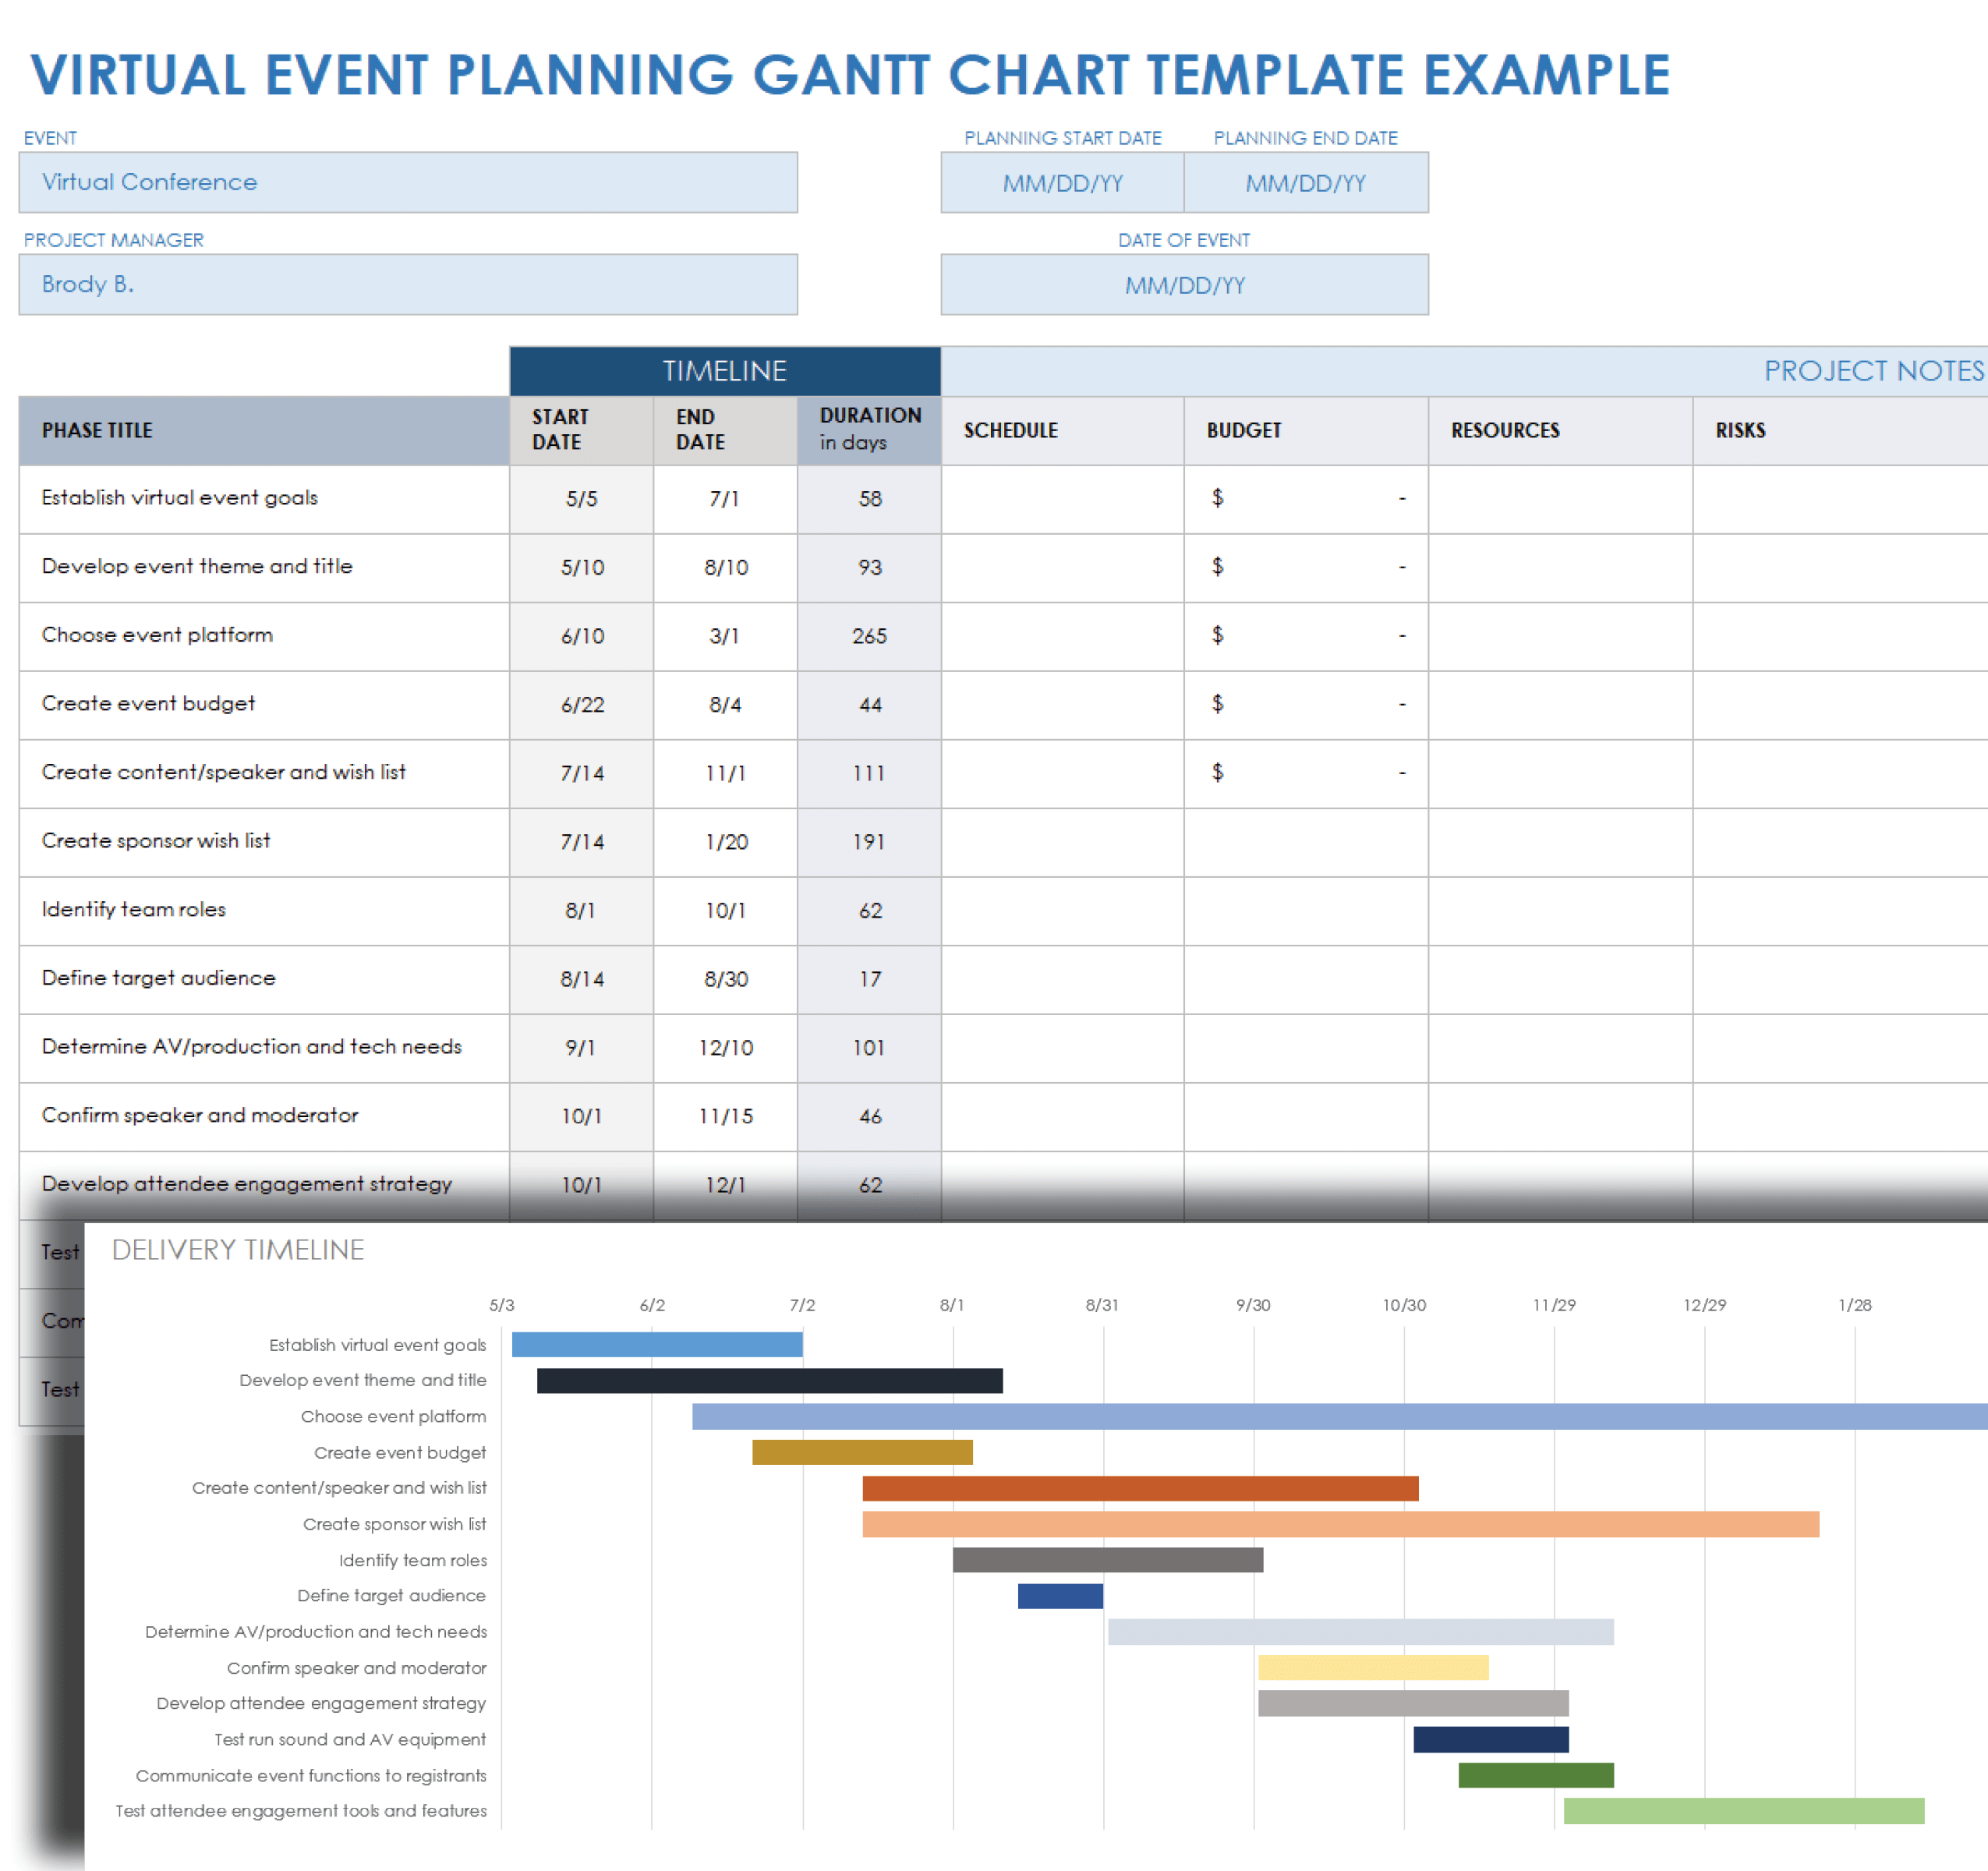
Download the Sample Virtual Event Planning Gantt Chart Template for Excel | Google Sheets
Download the Blank Virtual Event Planning Gantt Chart Template for Excel for Excel | Google Sheets
Event planning can be stressful and complicated. Use a Gantt chart to keep hiring staff, planning music and activities, and booking locations simple and organized. This Gantt chart demonstrates a timeline for planning a successful virtual event.
Gantt Chart Example for Event Marketing for Excel
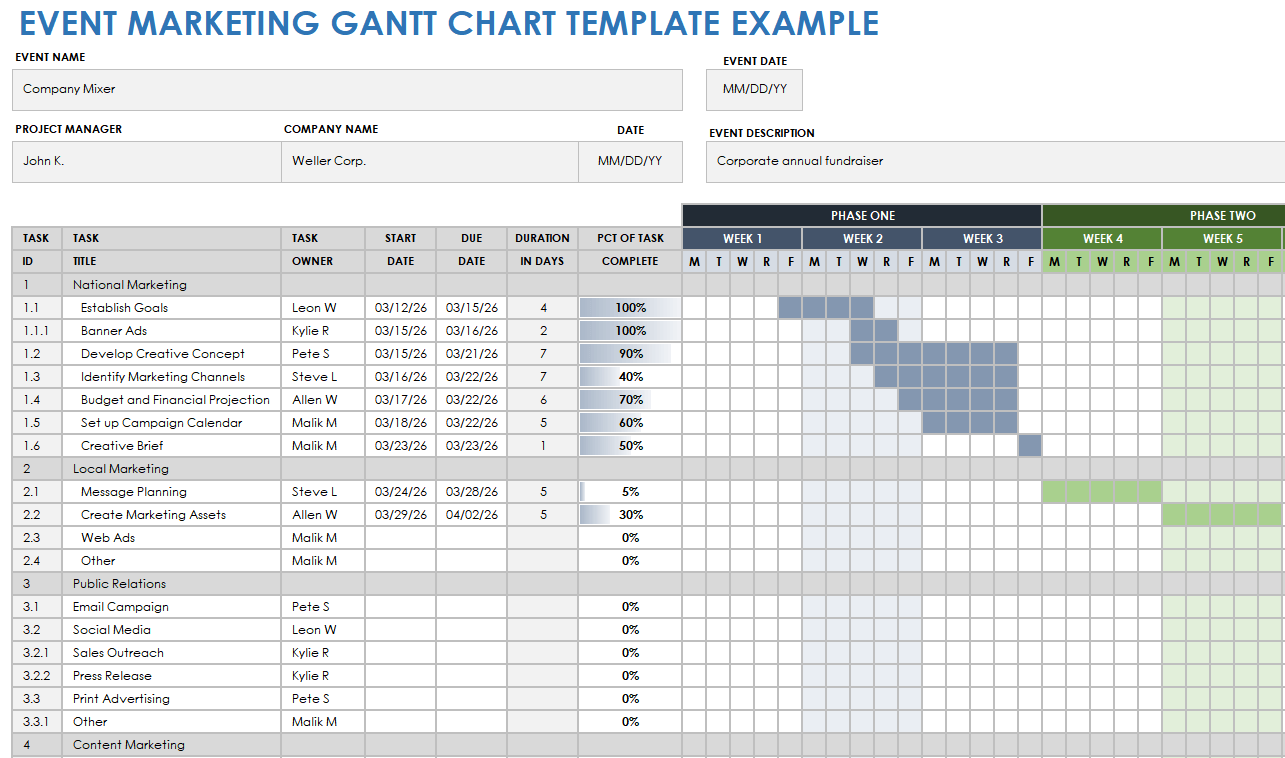
Download the Sample Event Marketing Gantt Chart Template for Excel Download the Blank Event Marketing Gantt Chart Template for Excel
For an event to be successful, teams need to devote resources to promoting it, reaching out to donors or potential guests, and ensuring there is media in place so that the event will be adequately covered. Track every part of your event marketing campaign simultaneously with this comprehensive color-coded Gantt chart.
Examples of Gantt Chart for Software Projects
For software projects, opt for Gantt charts that support Agile methodology. These charts break down projects into sprints, allowing you to track requests from stakeholders and clearly depict key dependencies.
“Gantt charts are used in both the Waterfall and Agile project management approaches,” says Rafał Gatkowski, Senior Python Developer at STX Next . “They perform especially well with Waterfall since a linear plan is developed to match customer expectations after gathering them at the beginning of a project. At STX Next, we mostly use the Agile approach to set our goals and use continuous customer feedback to update our plan in real time.”
Agile Gantt charts are a popular option for project managers leading software development projects. Assign various development teams to tackle different features, and trace dependencies using arrows.
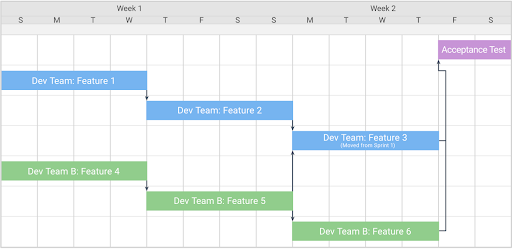
For projects with only one development team, you can use a simpler Gantt chart that tracks the status and dependencies of each individual task.
Gantt Chart Example for a Software Development Project for PowerPoint
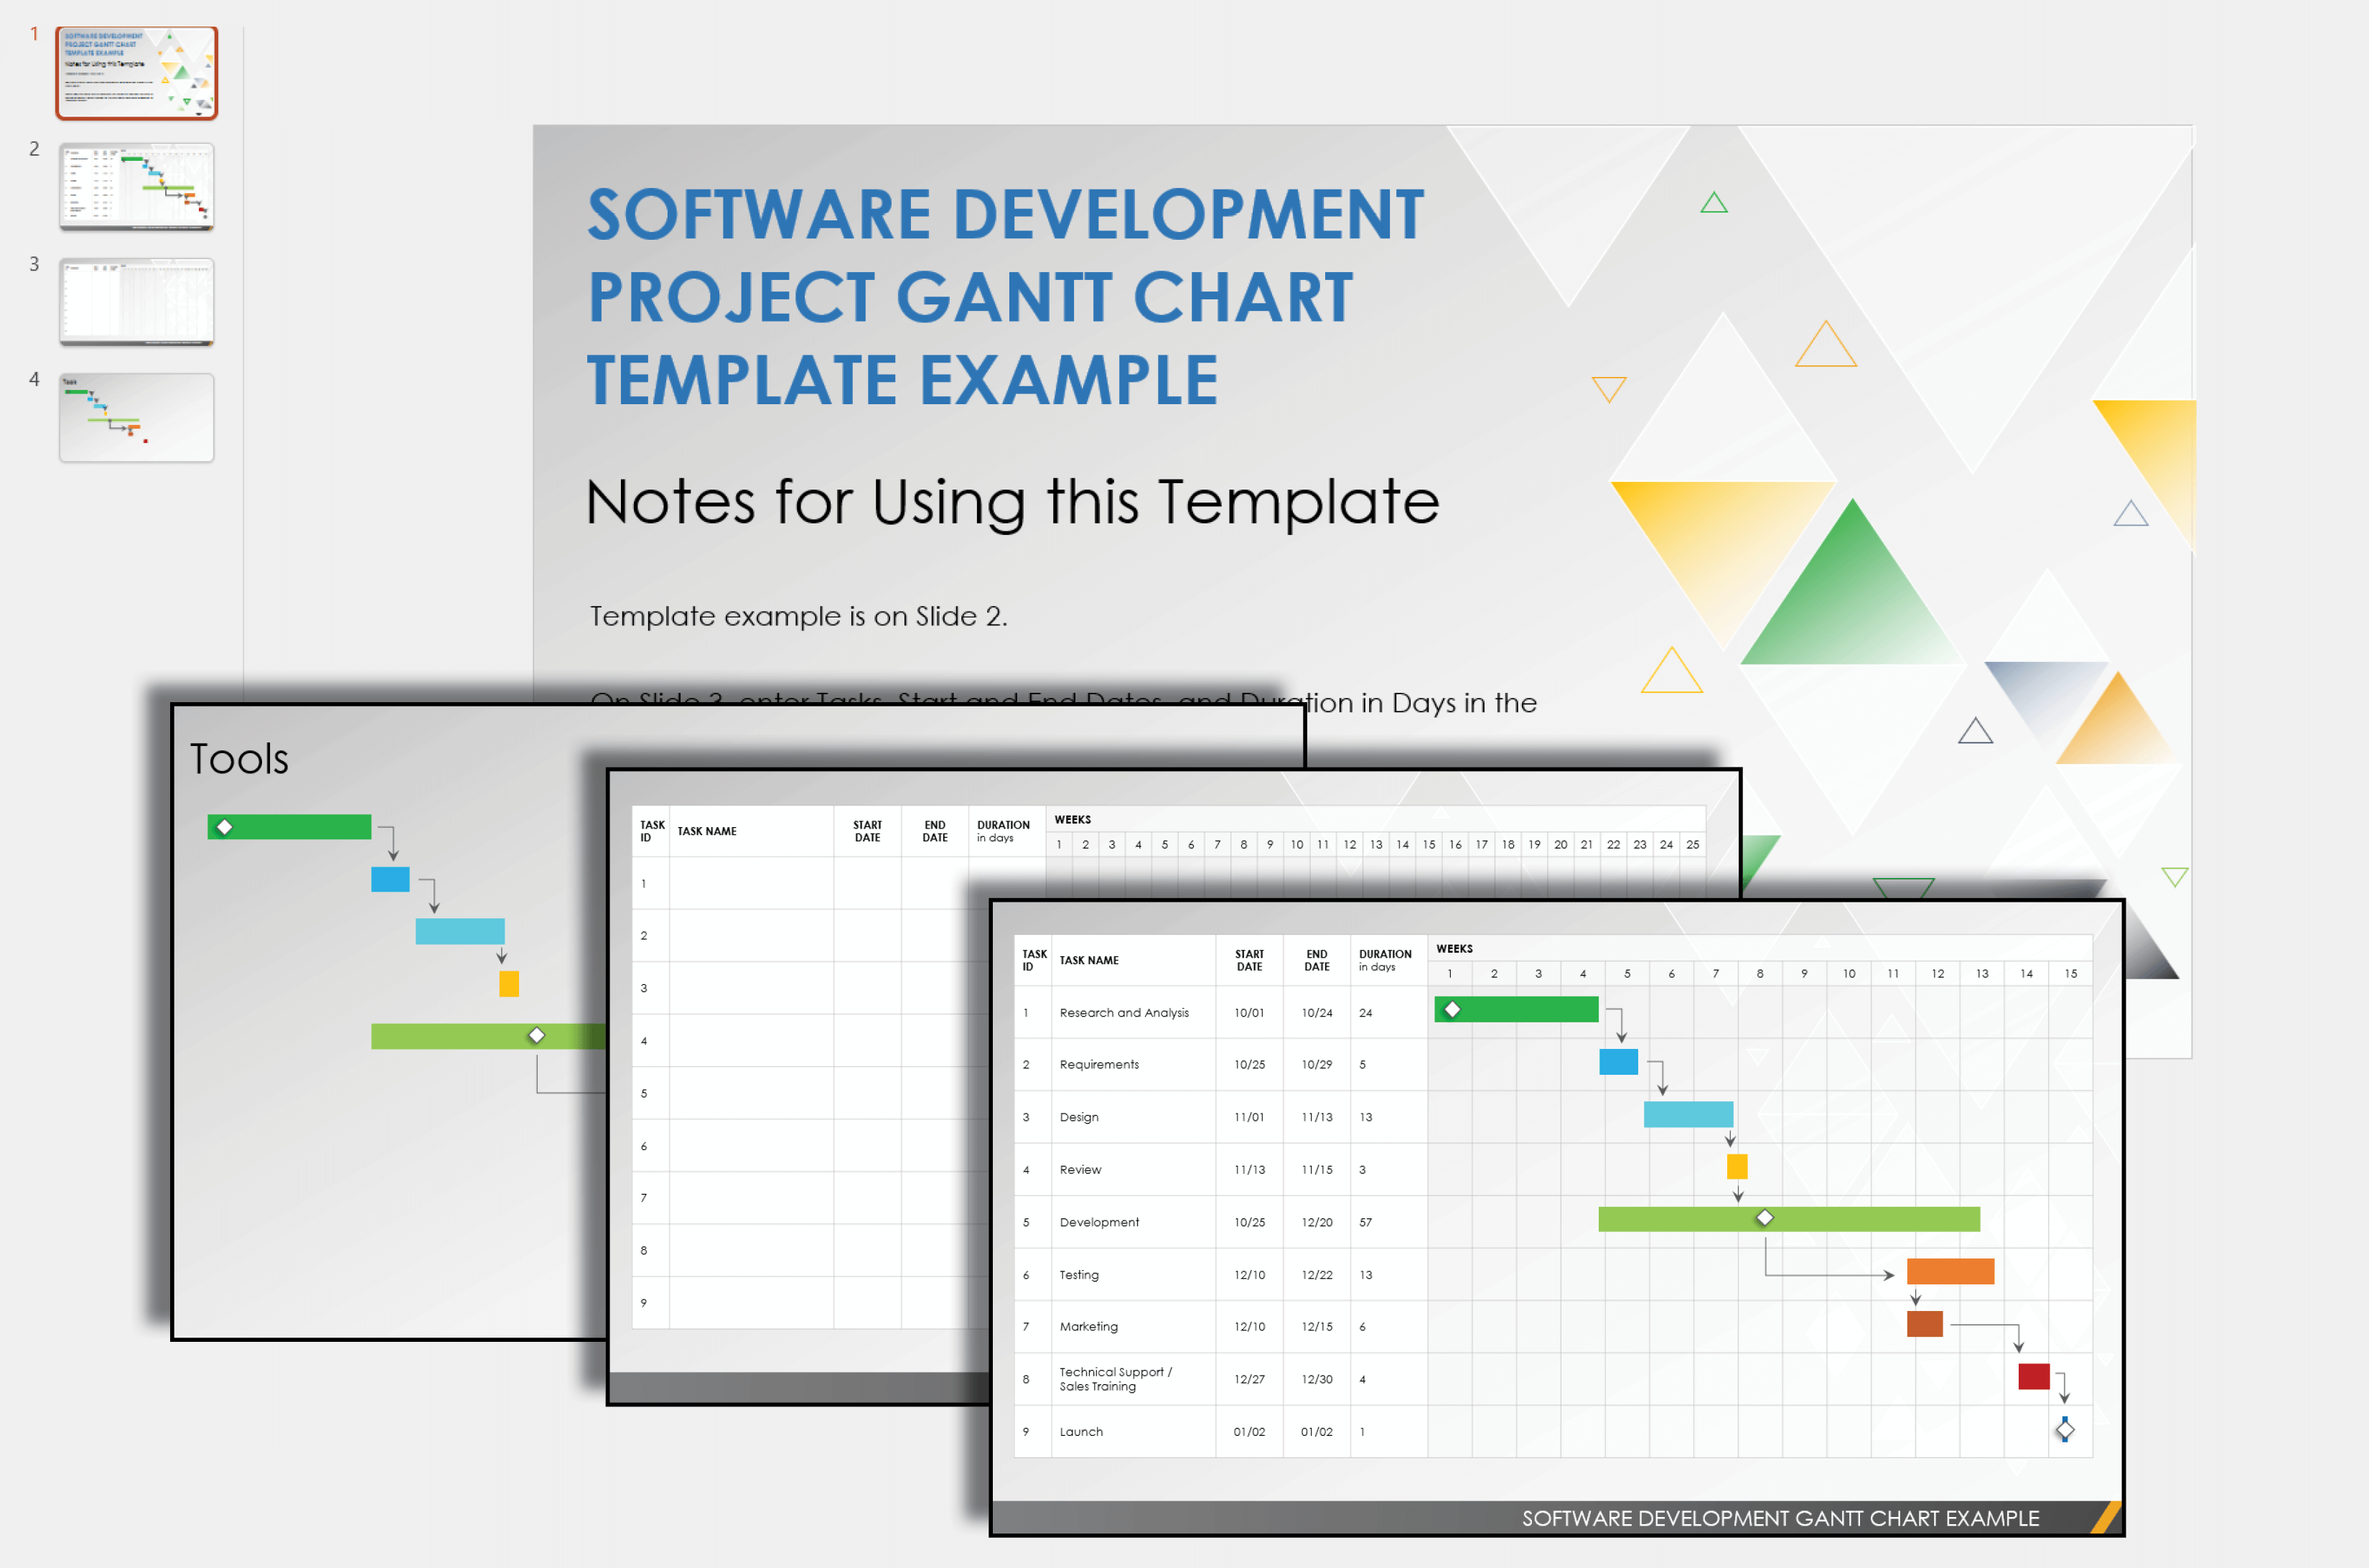
Download the Sample Software Development Project Gantt Chart Template for PowerPoint Download the Blank Software Development Project Gantt Chart Template for PowerPoint
This presentation-ready, Agile Gantt chart will help you map out, schedule, and share your software development project roadmap. Diamond symbols represent key milestones, while arrows indicate the dependencies among tasks.
Gantt Chart Example for Website Development
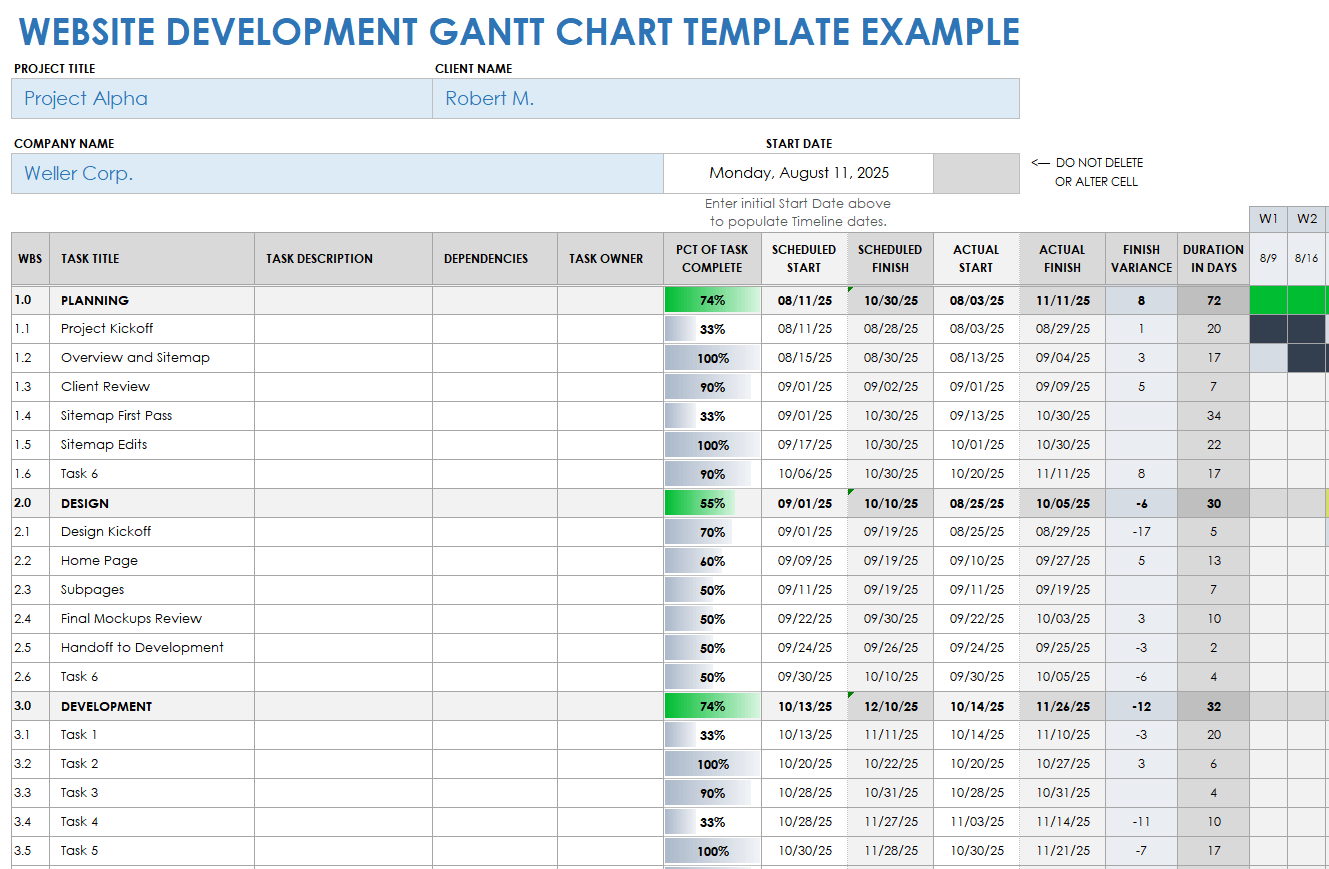
Download a Sample Website Development Gantt Chart Template for Excel | Google Sheets
Download a Blank Website Development Gantt Chart Template for Excel | Google Sheets
A user-friendly, functional website is key to the health of any company or brand. Account for every detail in the website development process by downloading a Gantt chart template for Excel or Google Sheets. Track due dates for design, features, development, and launch.
Gantt Chart Example in Software Engineering for Excel
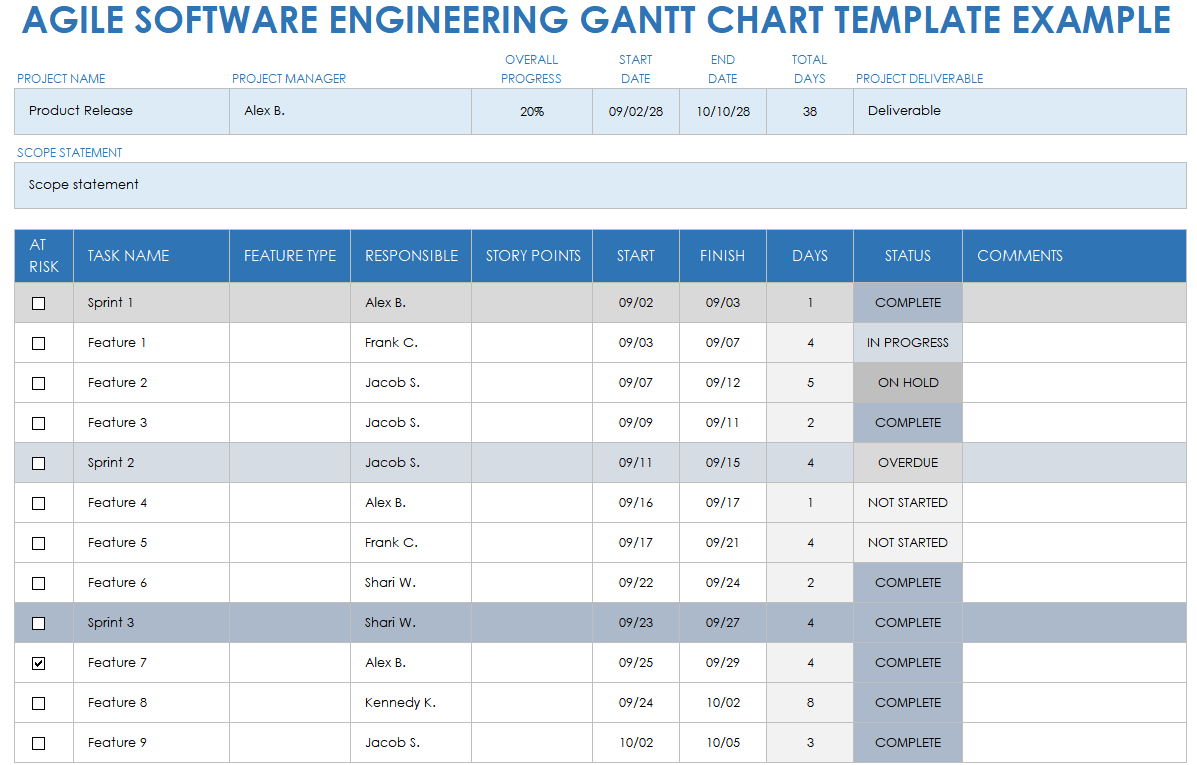
Download the Sample Agile Software Engineering Gantt Chart Template for Excel Download the Blank Agile Software Engineering Gantt Chart Template for Excel
Track each phase in a software engineering project with an Agile Gantt chart. This Gantt chart tracks the development of each feature, separating each into sprints. Download and customize the blank Gantt chart template to create a dynamic timeline for any Agile project.
External IT Project Gantt Chart Template for Excel
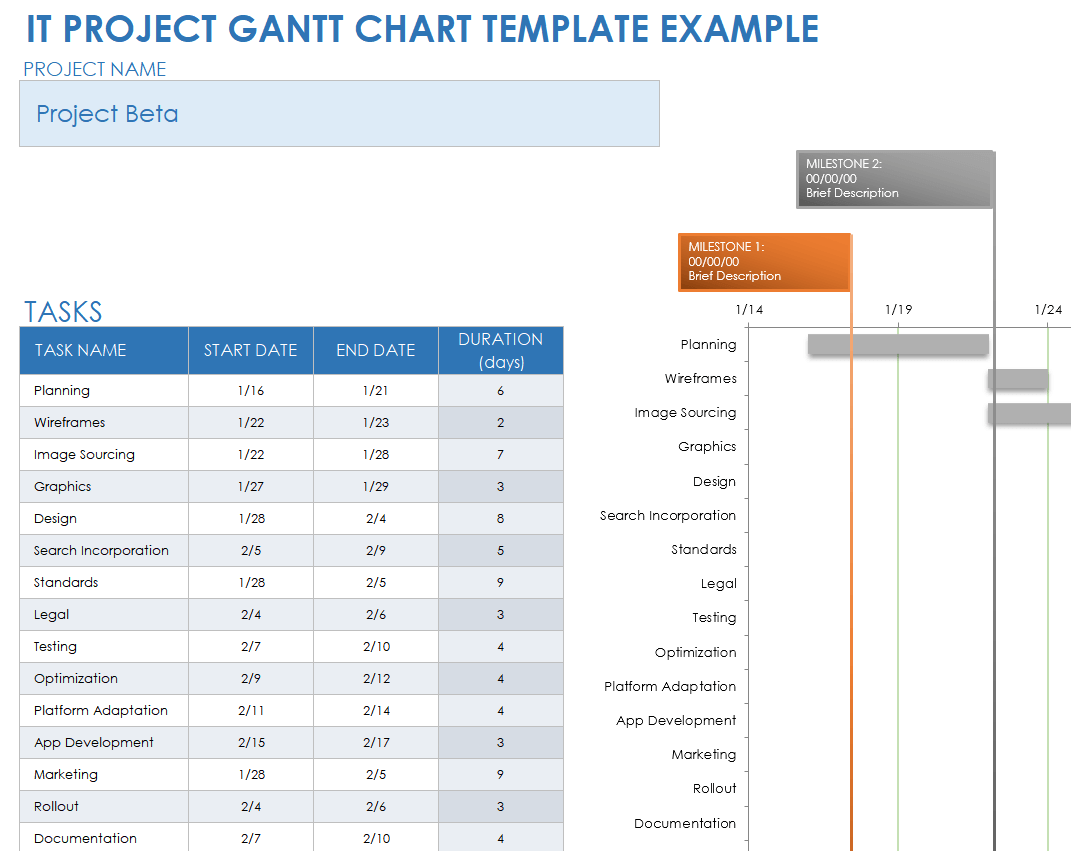
Download the Sample IT Project Gantt Chart Template for Excel Download the Blank IT Project Gantt Chart Template for Excel
Use this sample template as a comprehensive tool to help you plan and schedule an external IT project. Customize the project name, task names, and start and end dates in the left-hand column to populate the Gantt chart on the right. Select and move the milestone markers to indicate the various stages or milestones of your IT project.
Download the blank version to get started mapping your project timeline, or download the version with sample data to see how an IT project progresses from planning graphics to testing, rollout, and documentation.
Mobile App Development Agile Gantt Chart Example Template

Download the Sample Mobile App Development Agile Gantt Chart Template for Excel Download the Blank Mobile App Development Agile Gantt Chart Template for Excel
Gantt charts that incorporate Agile methodology are perfect for software projects such as mobile app development. In this sample template, you can see how to use an Agile Gantt chart to map the sprints in a mobile app development project, from research and analysis to launch.
See this comprehensive guide on using Gantt charts for Agile with a template and examples to learn more.
Project Management Gantt Chart Examples
Gantt charts are a fundamental tool in project management. These blank and example Gantt chart templates cover various areas of project management. Find samples that you can use as a guide for creating a proposal, planning, consulting on a roadmap, and more.
“Once properly created and maintained, a Gantt chart brings clarity to a lot of information, which improves the success of the project manager and, therefore, of the organization,” says Schiller. “Gantt charts help to improve project performance by improving coordination, decision making, and communication.”
Whether you’re consulting, drafting a project proposal, or leading a construction project, Gantt charts will help you stay on schedule. Try Gantt charts that incorporate the critical path method.
Gantt Chart Example for a Project Proposal for PowerPoint
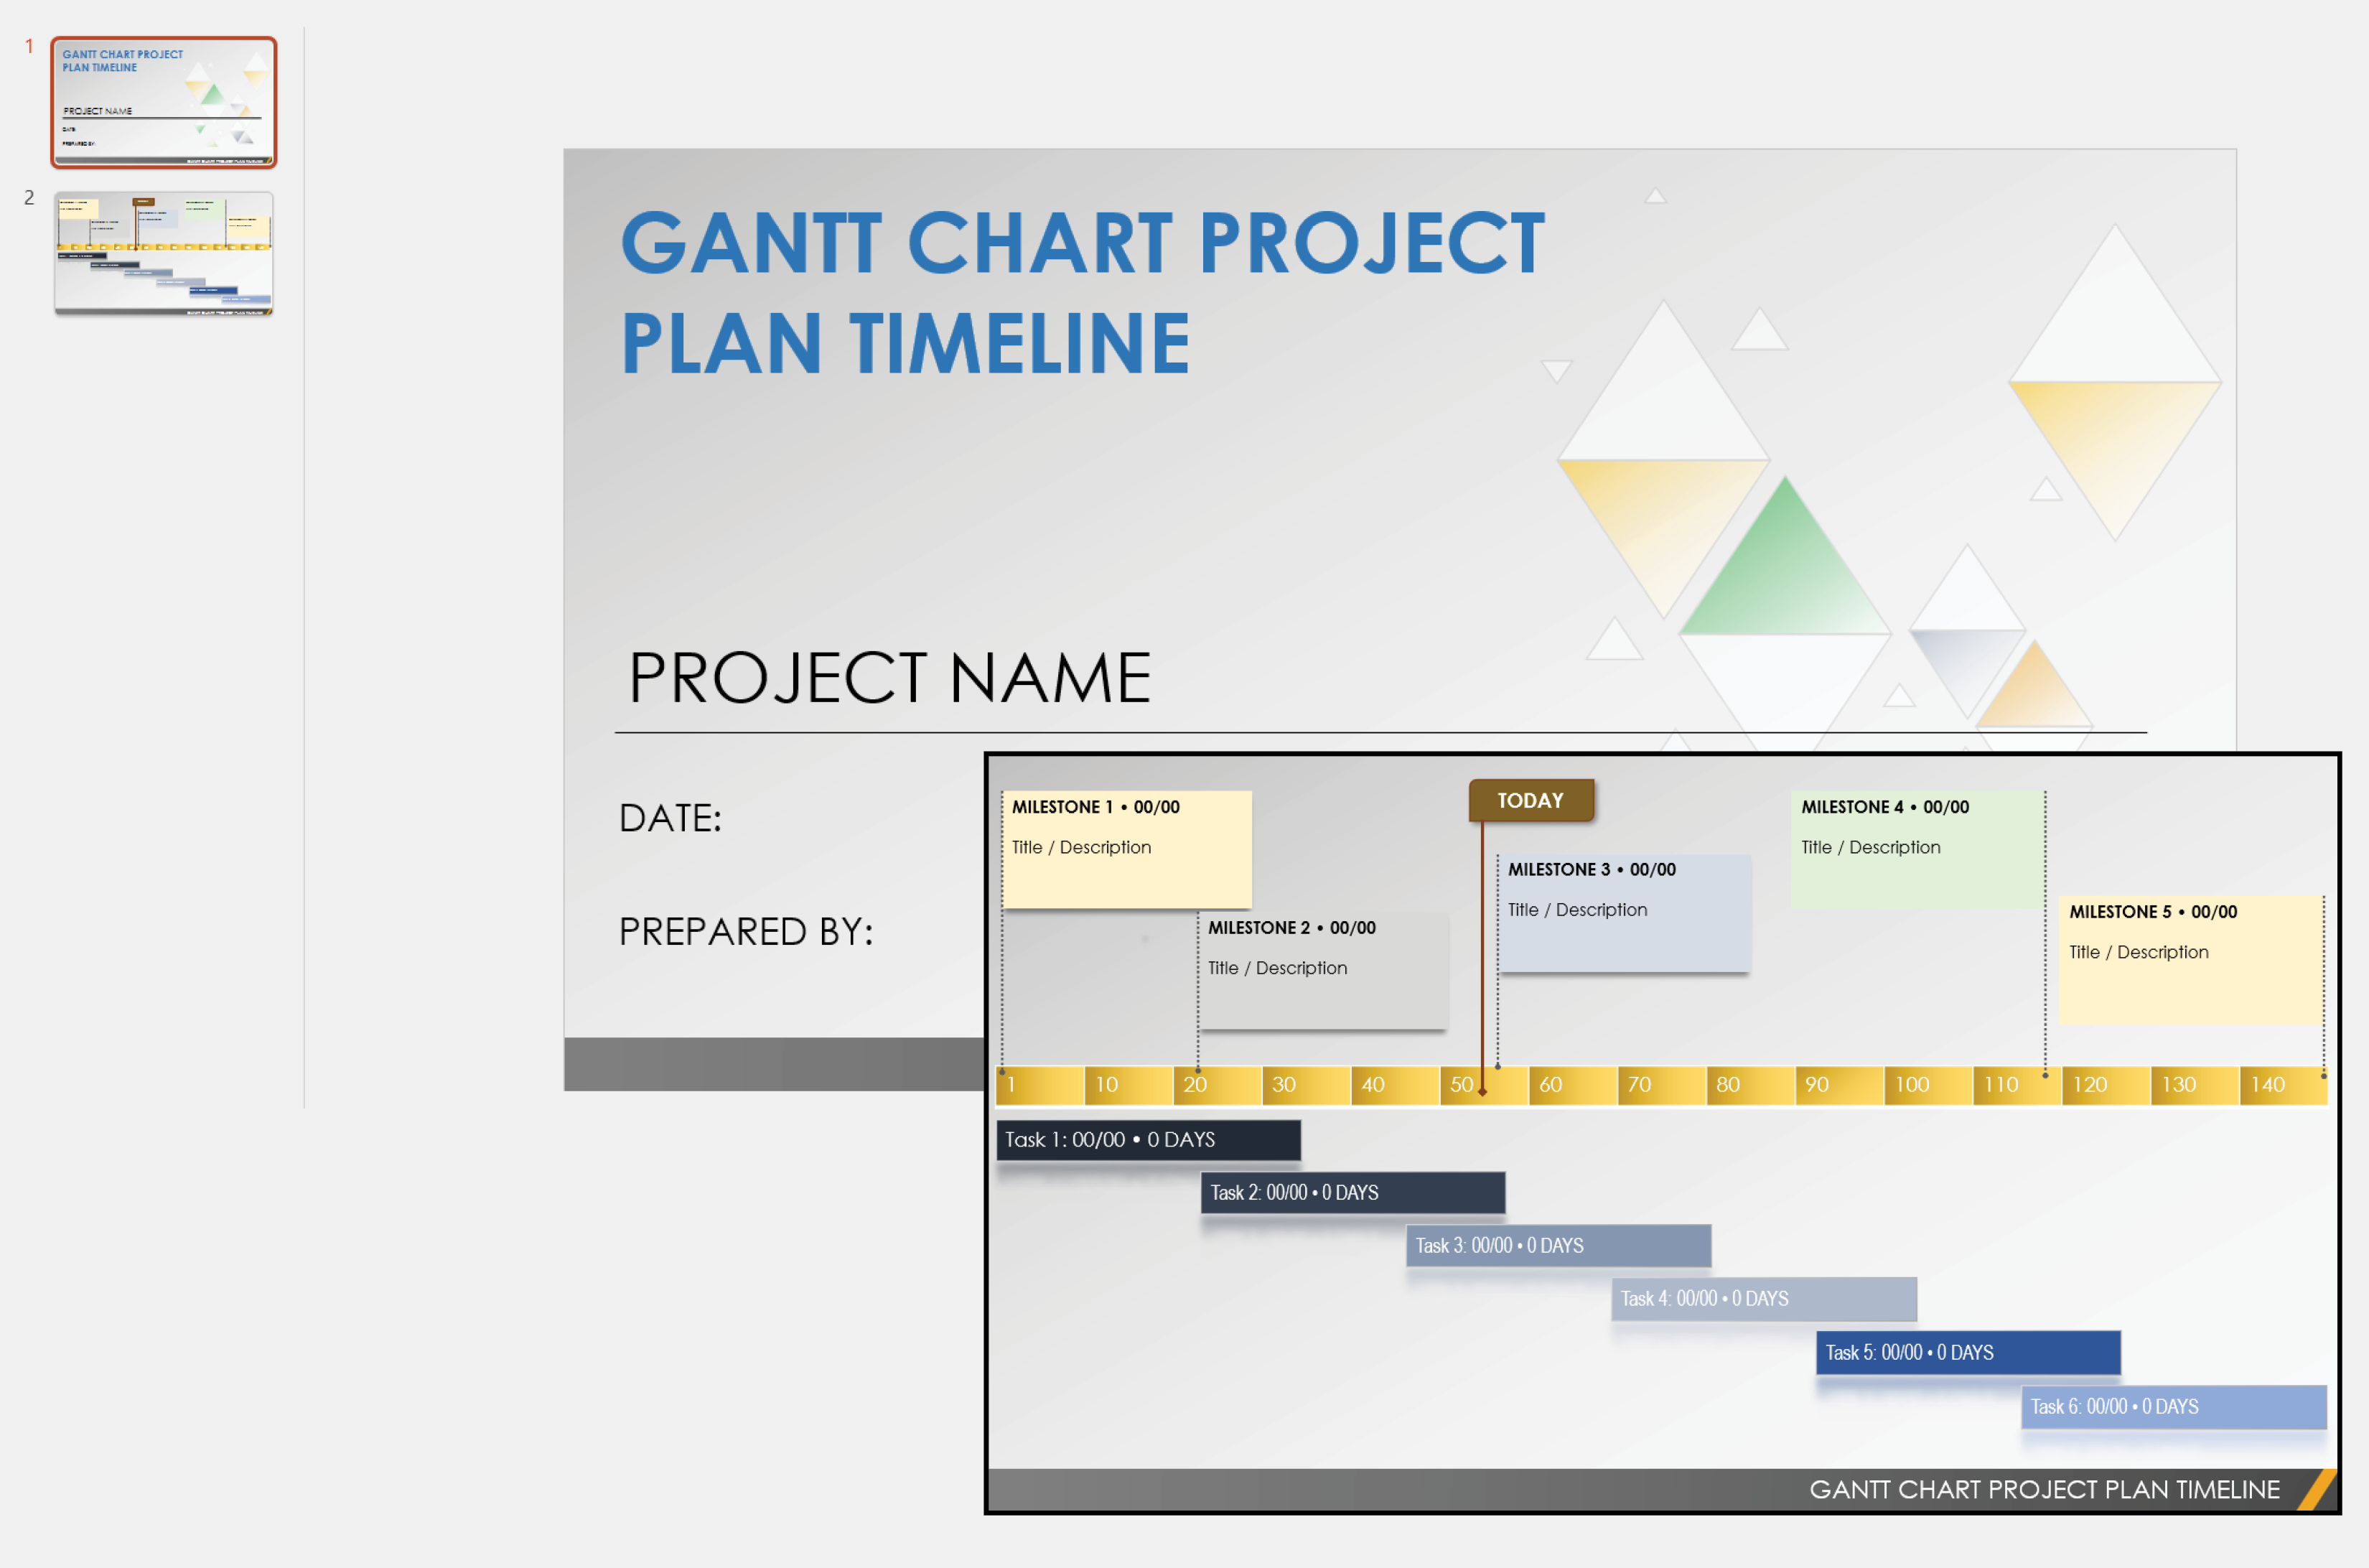
Download the Gantt Chart Project Plan Timeline for PowerPoint
Incorporate a Gantt chart into your project proposal presentation with this Gantt chart project plan timeline. This presentation-ready format is a great option for project managers who want to give a broad visual overview of the project timeline to stakeholders or company executives. Simply add this slide to your project proposal presentation to get the most out of this straightforward Gantt chart.
For more resources and information on project proposals, see this article on writing a winning project proposal .
Project Plan Gantt Chart Example with Template
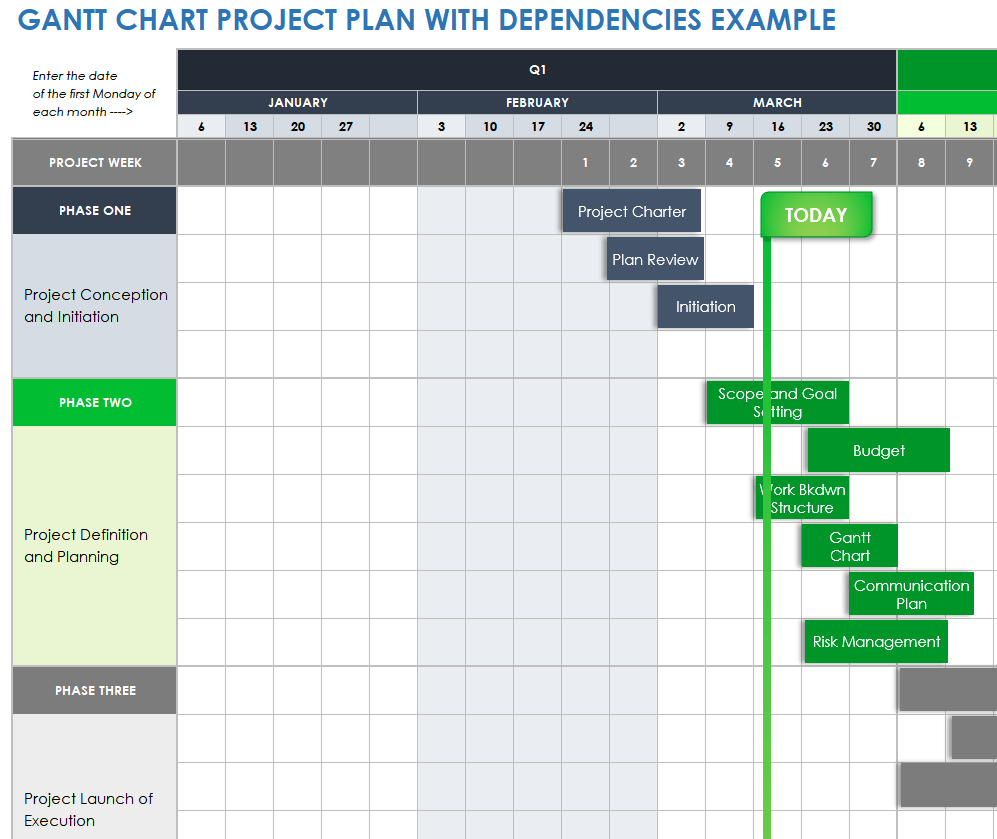
Download the Sample Gantt Chart Project Plan With Dependencies for Excel Download the Blank Gantt Chart Project Plan With Dependencies for Excel
A project plan is a more detailed version of a project proposal. Use a Gantt chart to allot your team enough time to research and write every section, including overview, scope, schedule, budget, and more. By doing so, you can rest assured that your project plan will be successful. Download the blank version to get started identifying your project plan phases, or download the version with sample data to see how much time to allow for each phase.
To learn best practices and find expert tips on creating project plans, see this guide to writing a winning project plan .
Gantt Chart Example for a Consulting Project Roadmap
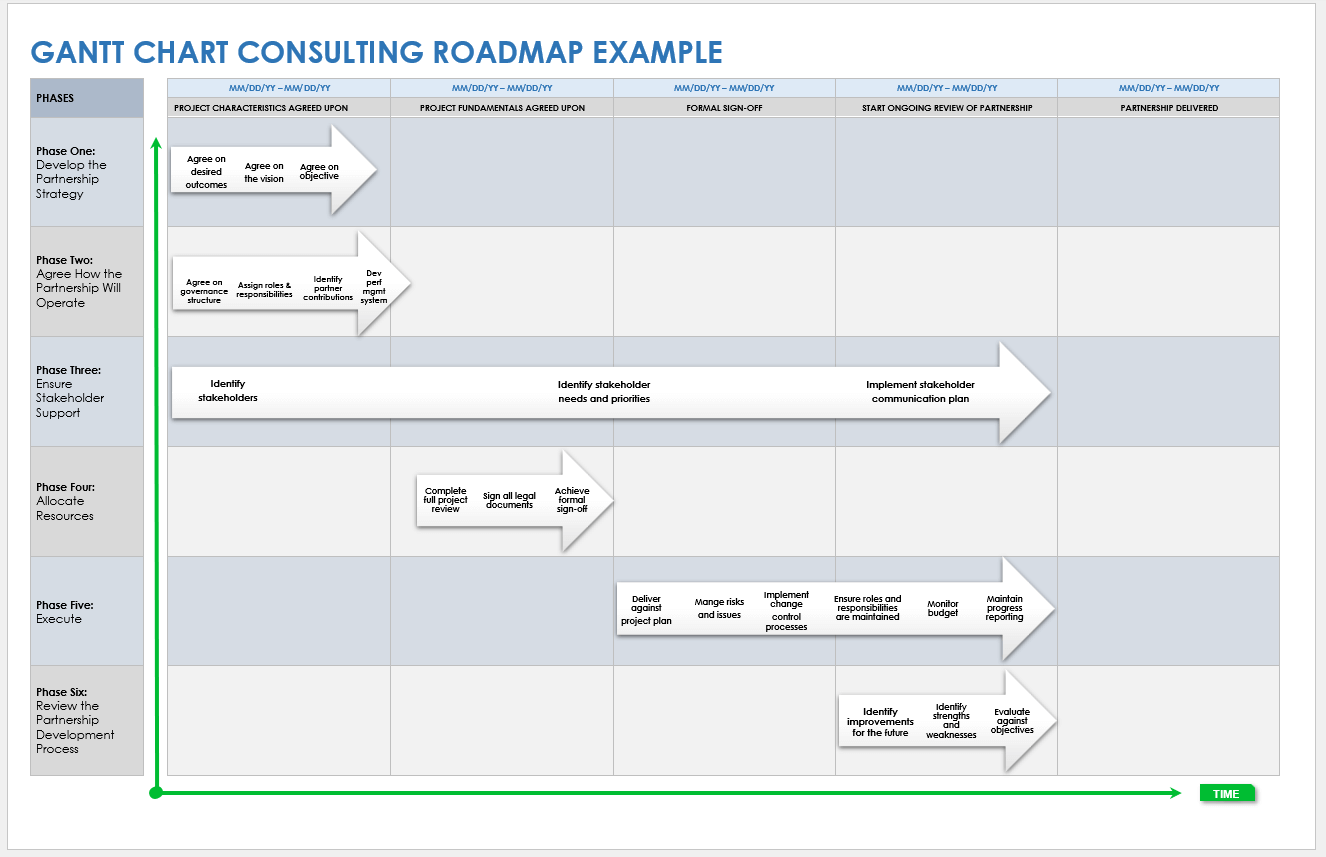
Download a Sample Consulting Project Gantt Chart Roadmap Template for Microsoft Word | PowerPoint | Google Slides
Download a Blank Consulting Project Gantt Chart Roadmap Template for Microsoft Word | PowerPoint | Google Slides
Create a consulting project roadmap as a Gantt chart to produce a clear and visually dynamic graphic of your timeline. In this example, every part of a consulting project, from developing partner strategy to reviewing the partnership development process, has a phase with individual tasks to which you can assign an owner, deadline, and status.
Construction Project Gantt Chart Example with a Critical Path
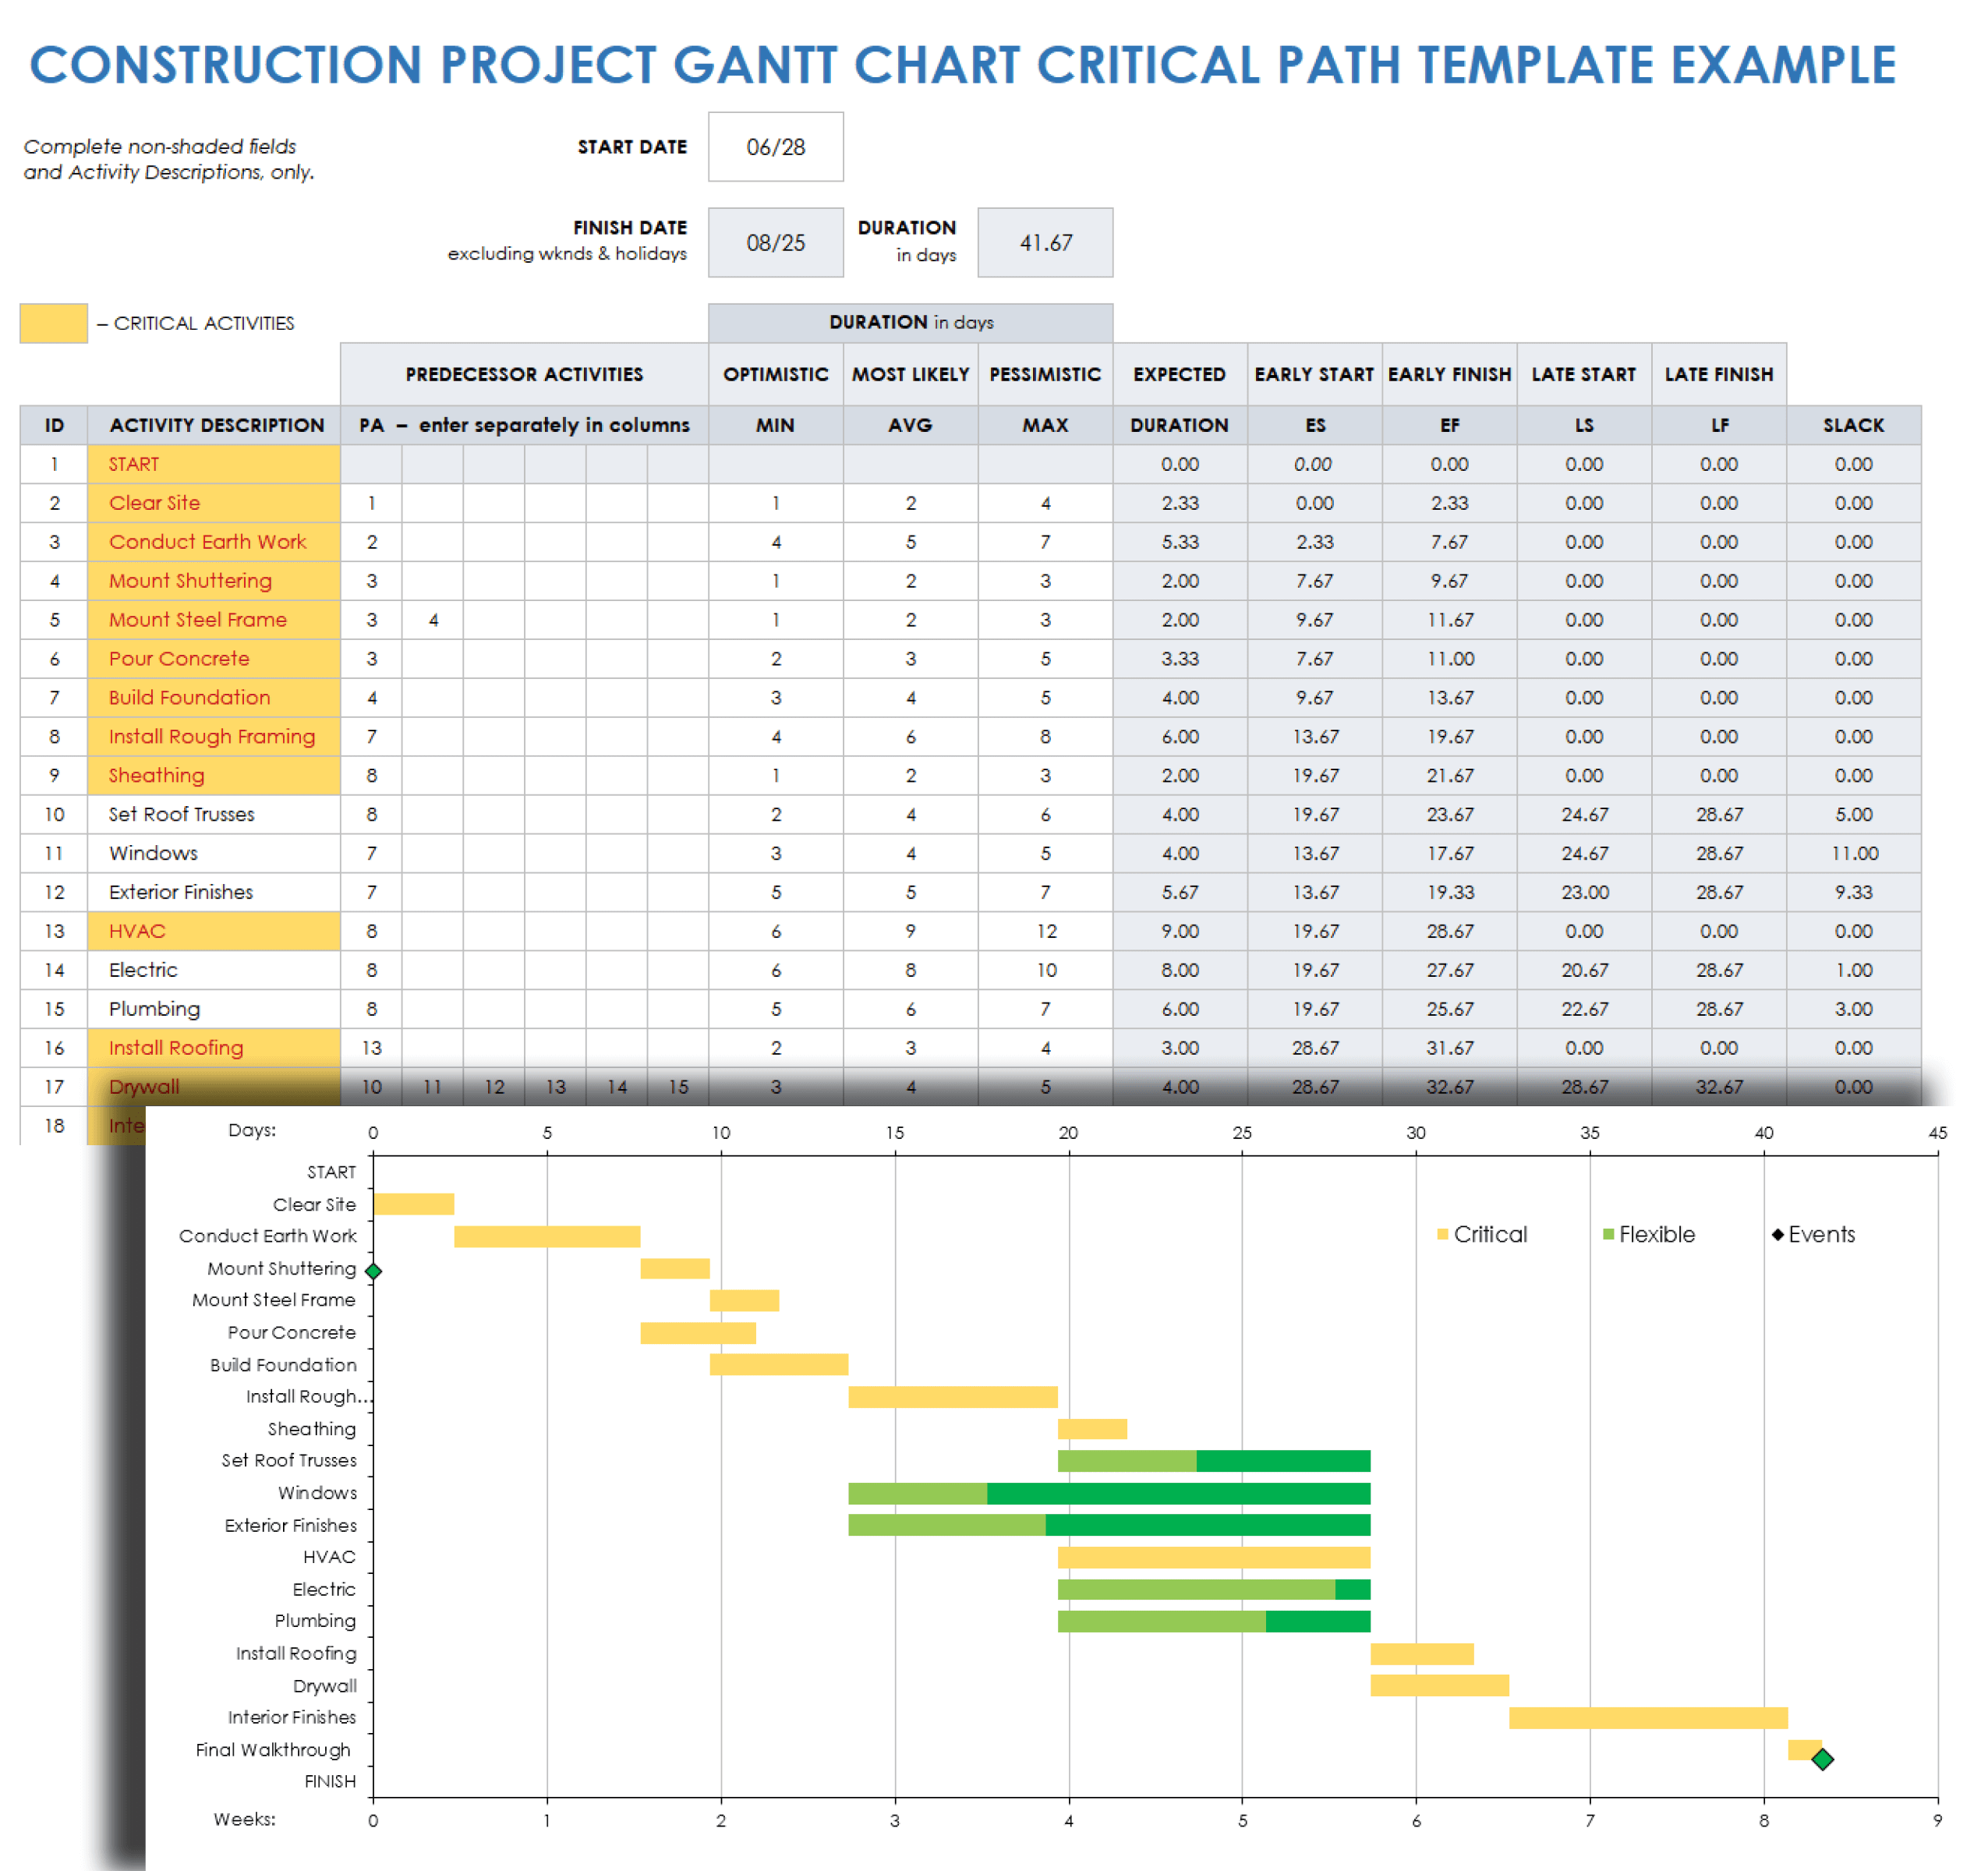
Download the Sample Construction Project Gantt Chart Critical Path Template for Excel Download the Blank Construction Project Gantt Chart Critical Path Template for Excel
By combining Gantt charts with the critical path method (CPM), project managers can optimize their schedules and minimize unexpected delays. Although CPM is appropriate for any project, it is particularly useful for those with many strict dependencies, such as construction projects.
Try this free, customizable template that combines Gantt charts with critical path methodology. Download the blank version, and enter your tasks, start and finish dates, assignees, and statuses. The template will populate the Gantt chart at the bottom of the spreadsheet as you enter your data. You can also download the version with sample data for a construction project Gantt chart example.
Learn about Gantt charts and the critical path method in this CPM guide with templates and examples .
Product Development Management Gantt Chart Examples
A Gantt chart can help simplify even the most ambitious product development project. From ideation and research to costing and commercialization, these Gantt chart examples can help set you and your team up for success.
“Gantt charts outline the proper order for completing tasks, as well as the amount of time required,” says Gatkowski. “Having this knowledge is useful while managing projects, as you can monitor the progress, plan the whole project, and manage resources. Project managers can check to see if specific activities are finished on time and modify the project plan accordingly.”
New Product Development Gantt Chart Example for Microsoft Word
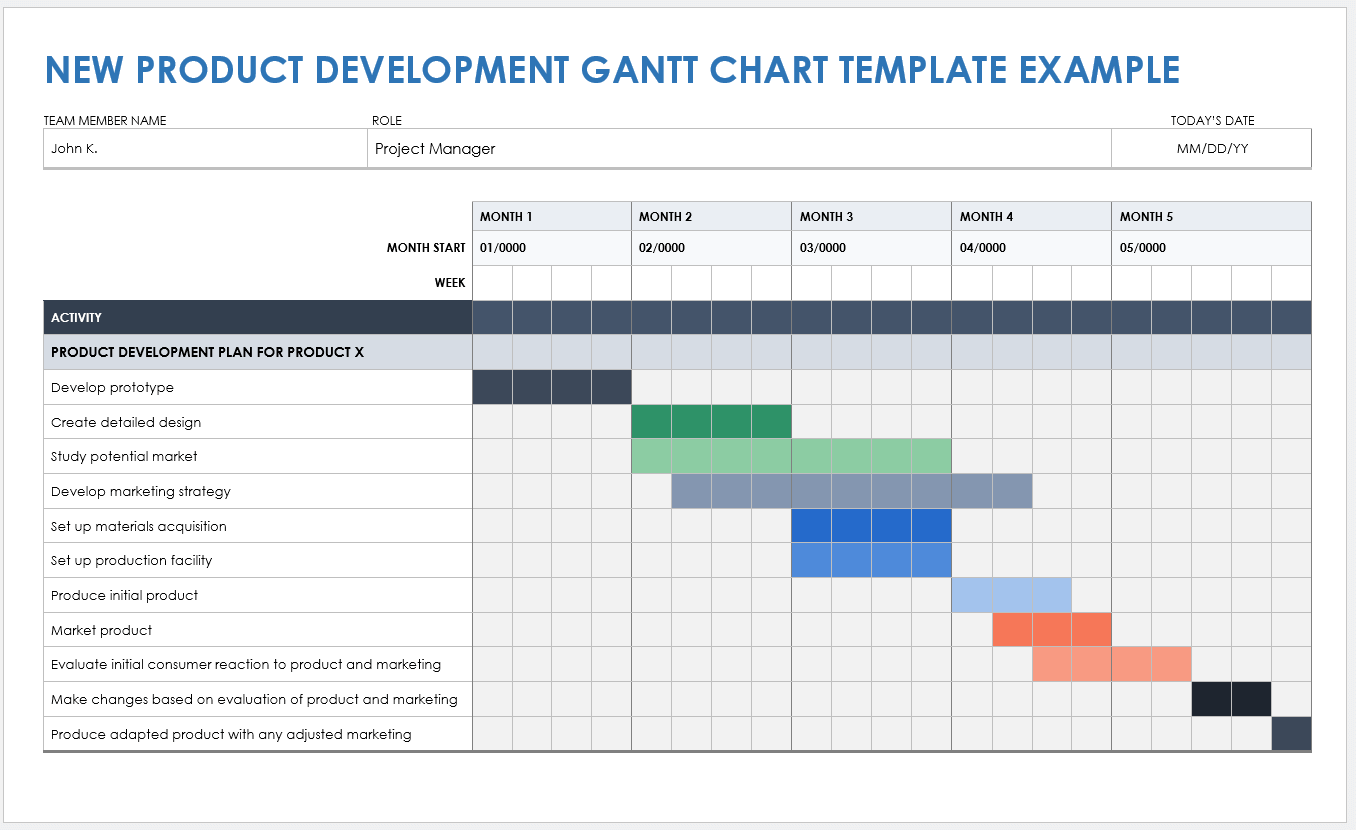
Download the Sample New Product Development Gantt Chart Template for Microsoft Word Download the Blank New Product Development Gantt Chart Template for Microsoft Word
A new product development project requires careful planning. Try this simple Gantt chart to break down your project into manageable segments, such as developing a prototype, setting up materials acquisition, and creating a marketing plan.
Gantt Chart Example for Product Roadmap
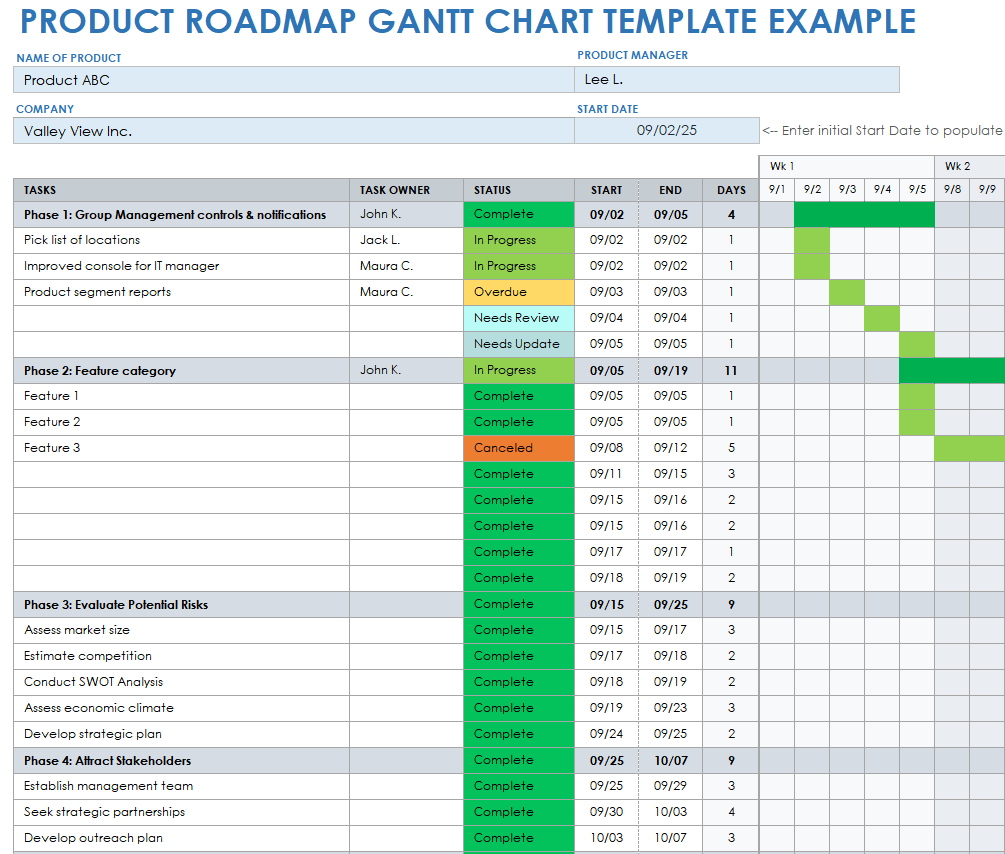
Download a Sample Product Roadmap Gantt Chart Template for Excel | Google Sheets
Download a Blank Product Roadmap Gantt Chart Template for Excel | Google Sheets
Create a product roadmap using this comprehensive Gantt chart tool. Track every product feature as you move through the development process, from grouping management controls and notifications to drafting product segment reports.
Product Launch Gantt Chart Example for Excel
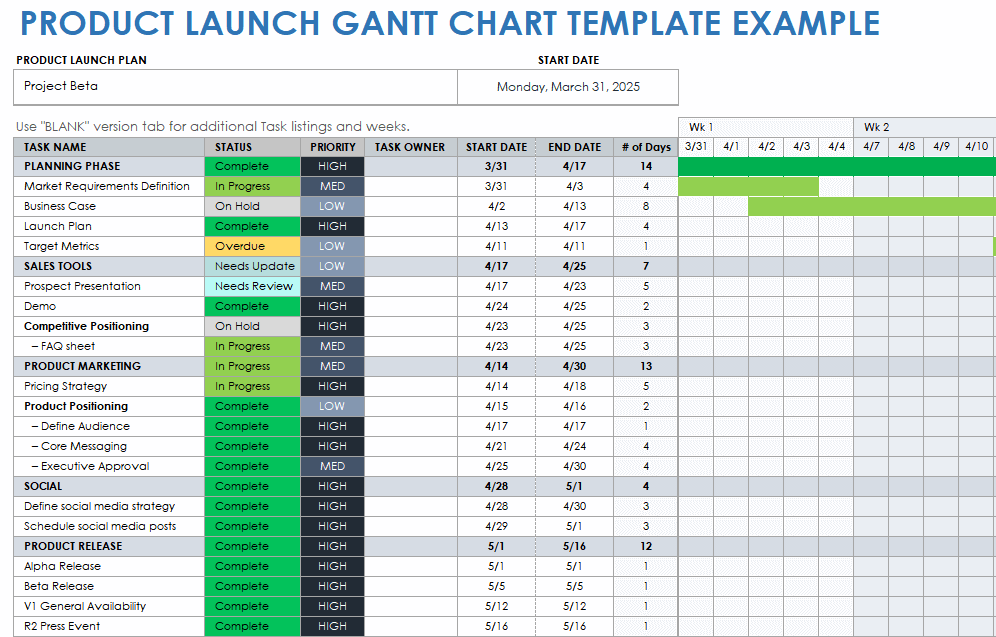
Download the Sample Product Launch Gantt Chart Template for Excel Download the Blank Product Launch Gantt Chart Template for Excel
This Gantt chart design for Excel allows you to track tasks and phases of a product launch. Copy and paste statuses from the color-coded key on the right-hand side of the template to ensure that anyone can take a quick look at your Gantt chart and understand the status of your product launch. Download the version with sample text to use as a guide to get started or the blank version to enter your own details.
Gantt Chart Example for the Manufacturing Process
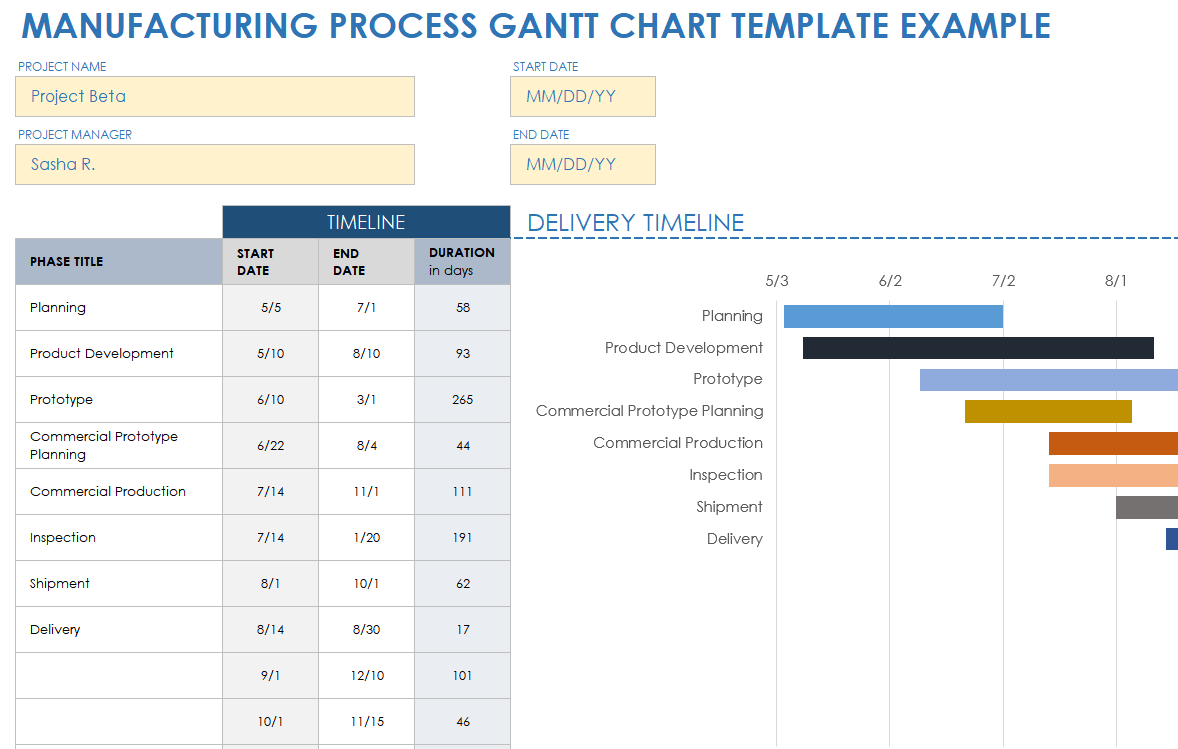
Download a Sample Manufacturing Process Gantt Chart Template for Excel | Google Sheets
Download a Blank Manufacturing Process Gantt Chart Template for Excel | Google Sheets
Try this simple Gantt chart template to keep track of every phase in the manufacturing process. In this example, see how the manufacturing process moves from planning and product development to inspection, shipment, and delivery. Enter start and end dates for each task, and watch the Gantt chart populate with color-coded bars.
Gantt Chart Examples for Human Resources
Human resources (HR) departments can use Gantt charts for varying projects. Download a sample template to help get you started on your HR Gantt chart, or use a basic Gantt chart template to plan your project schedule from scratch.

“Gantt charts can be used for a variety of HR-related projects, such as onboarding new employees, planning company-wide training events, and tracking employee performance goals,” says Linda Shaffer, Chief People and Operations Officer at Checkr . “They are particularly useful for projects that involve multiple teams or individuals, as they provide a clear way to track progress and identify potential risks and issues.
“For example,” Shaffer continues, “if you're planning a company-wide training event, you can use a Gantt chart to track the progress of each team as they complete their training. This way, you can see at a glance which teams are on track and which ones are behind schedule.”
Gantt Chart Example for Interview Process
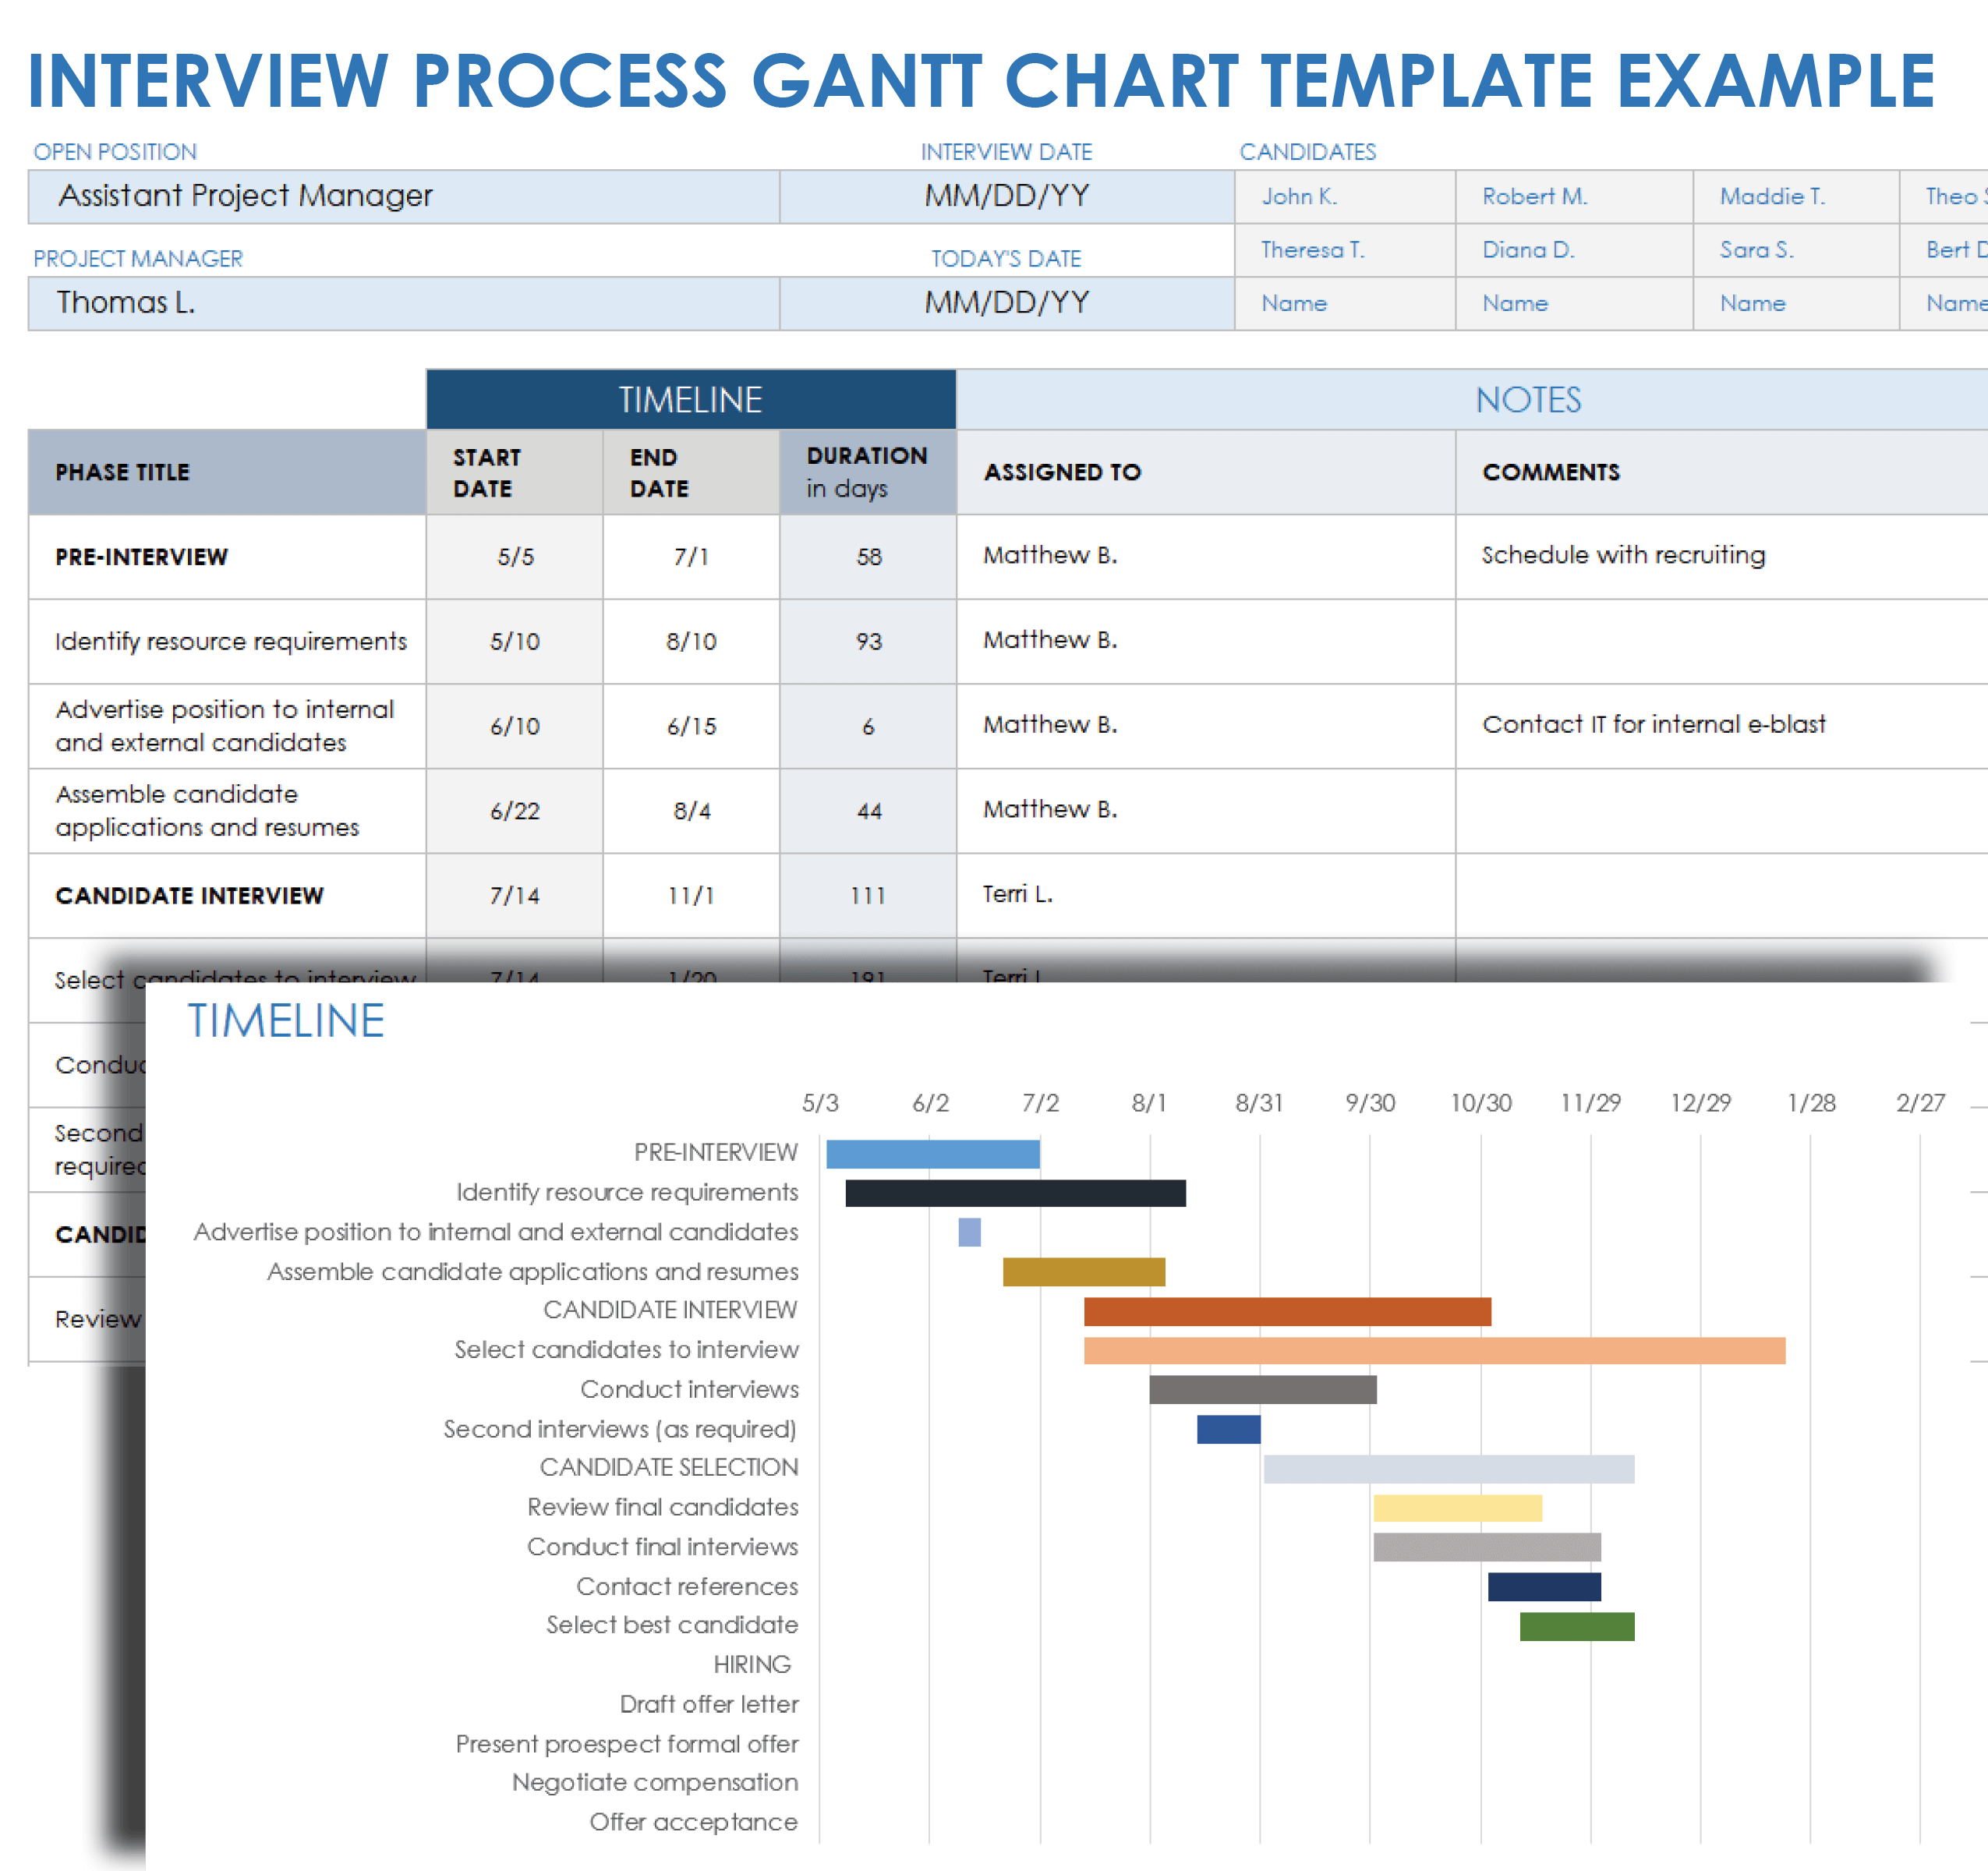
Download a Sample Interview Process Gantt Chart Template for Excel | Google Sheets
Download a Blank Interview Process Gantt Chart Template for Excel | Google Sheets
Hiring a new employee takes time, resources, and careful consideration. Stay organized throughout the process, from pre-interviewing to hiring, with a comprehensive and visually dynamic Gantt chart. Complete each section of the pre- and candidate-interview phases, candidate selection, and hiring. This interview process Gantt chart example sets a timeline that ensures everyone who needs to talk to a potential new hire does before you send the offer.
Employee Onboarding Gantt Chart Example
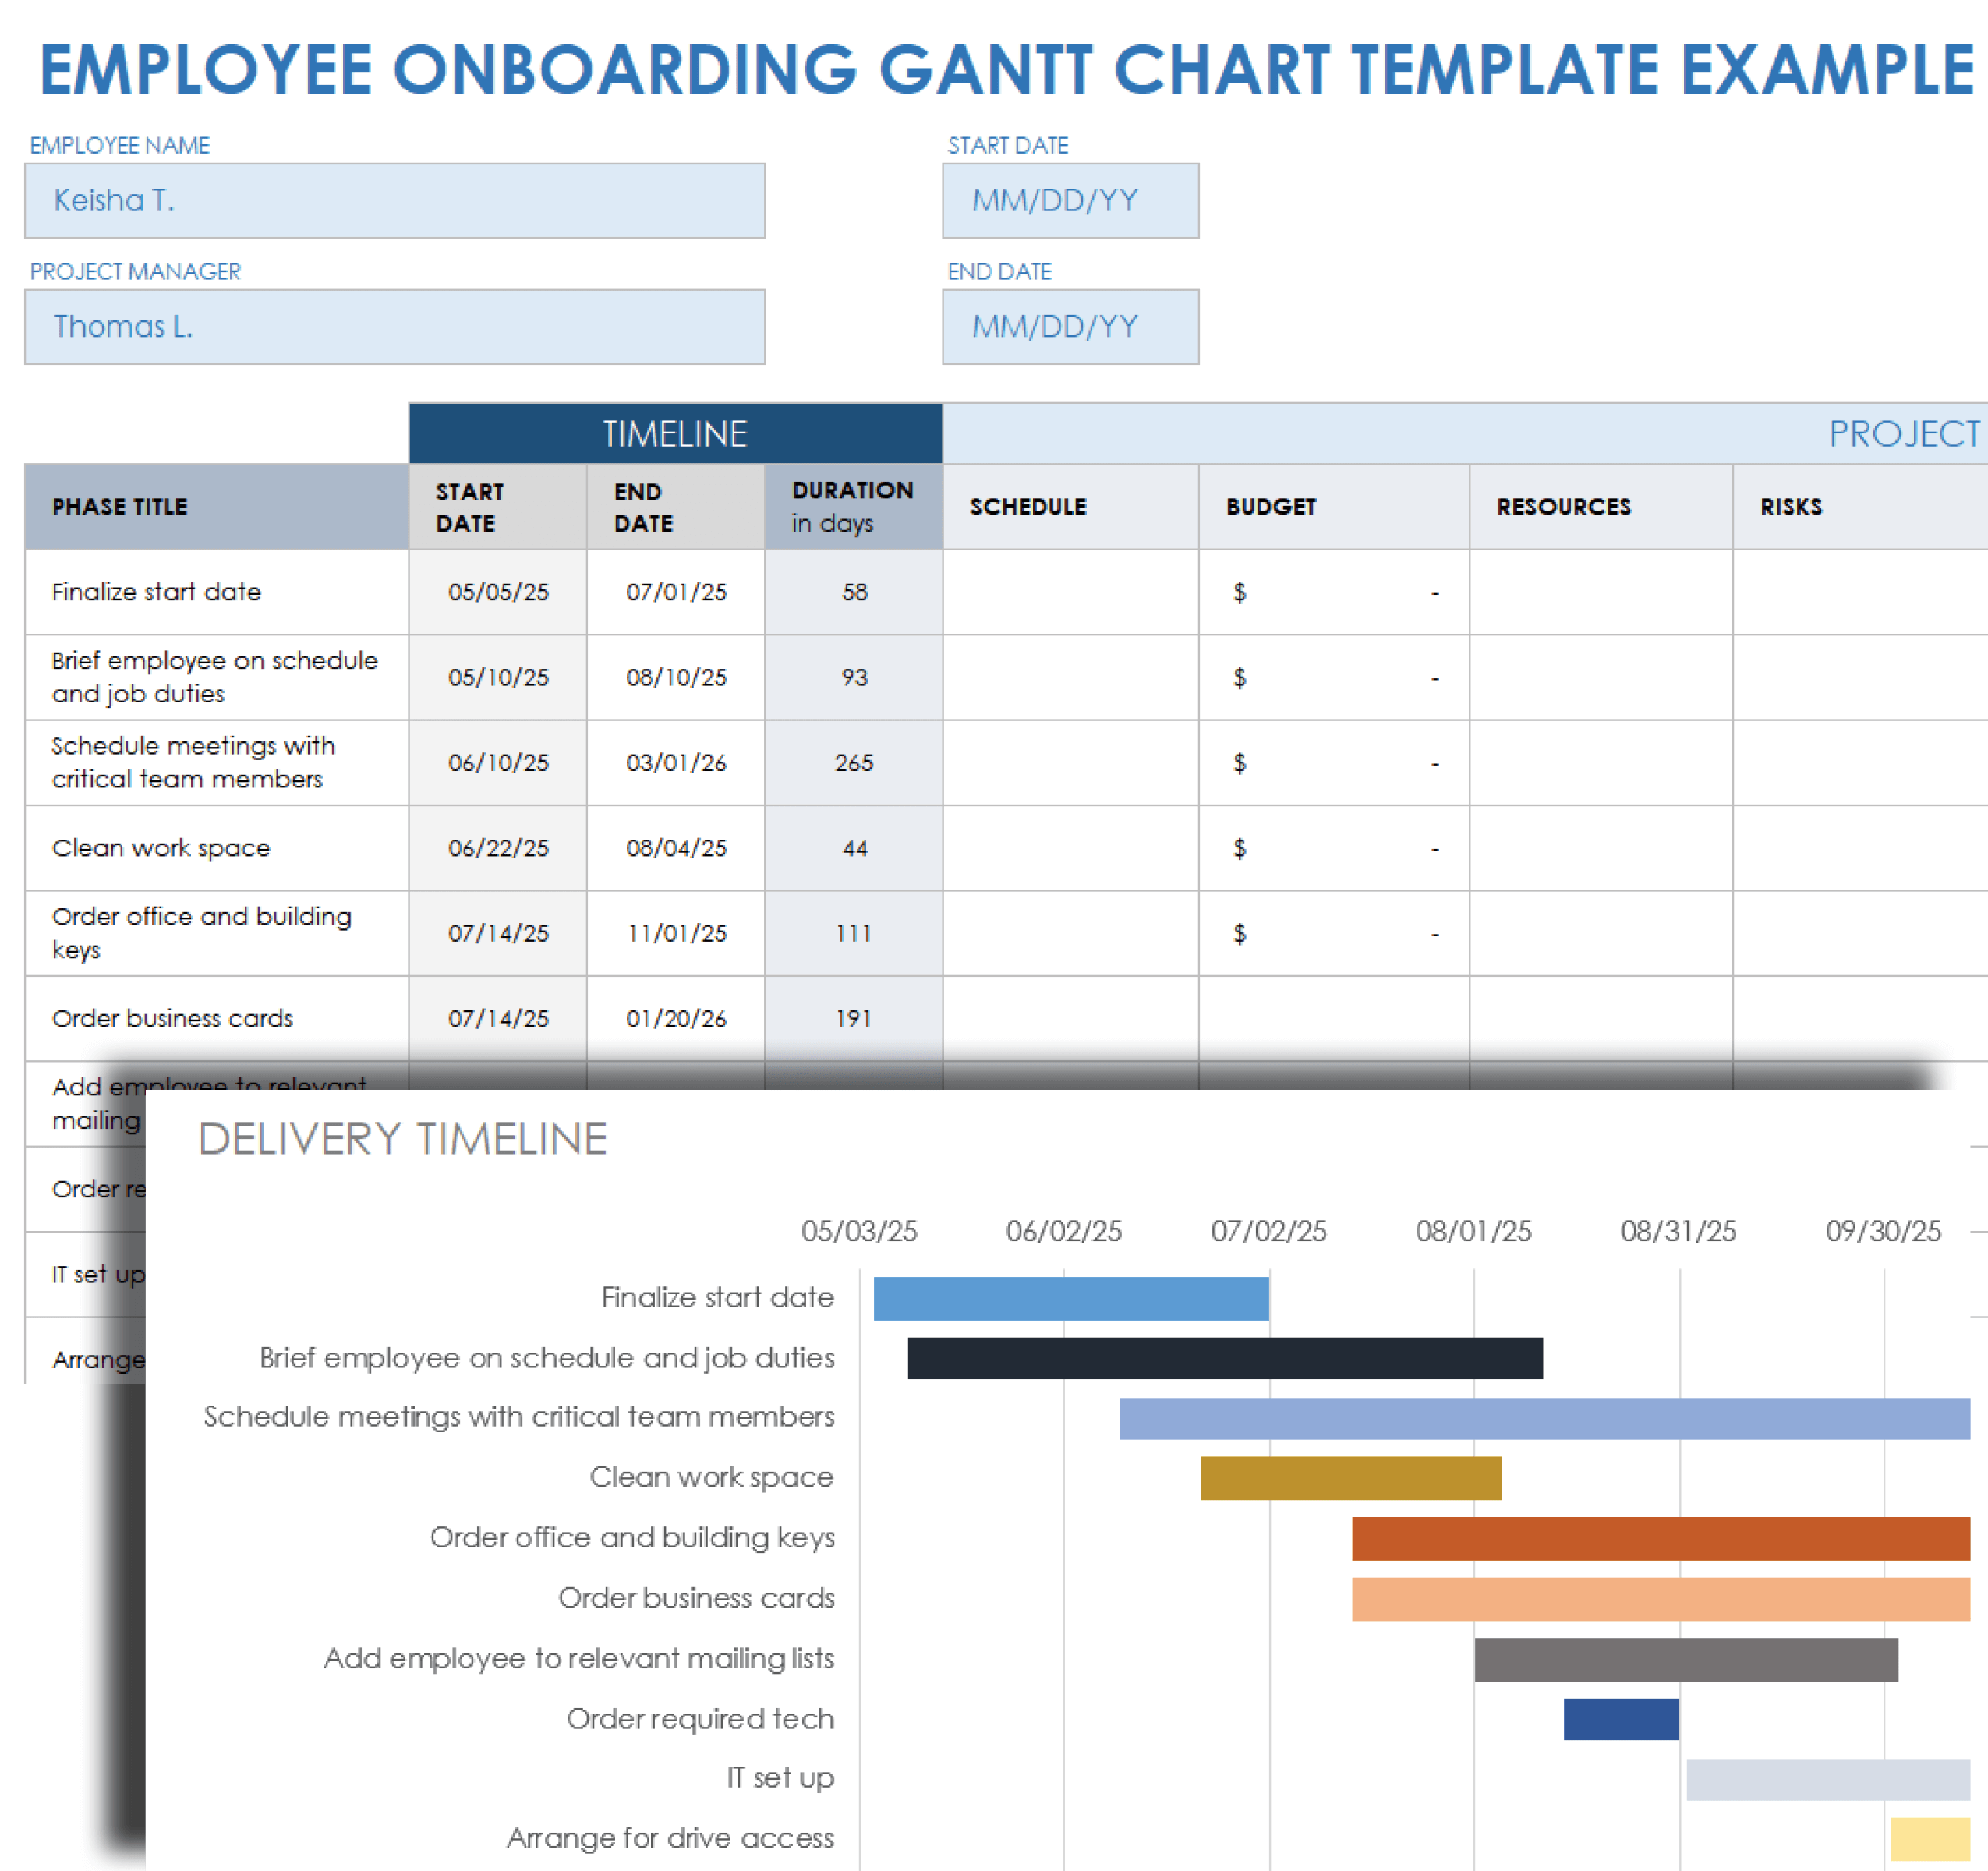
Download a Sample Employee Onboarding Gantt Chart Template for Excel | Google Sheets
Download a Blank Employee Onboarding Gantt Chart Template for Excel | Google Sheets
Well-organized employee onboarding processes help improve an employee’s long-term experience at a company and decrease overall employee turnover. This Gantt chart illustrates the path to preparing for a perfect first day on the job.
Download these onboarding templates and checklists for more HR tools and advice.
Gantt Chart Example for Human Resources Planning
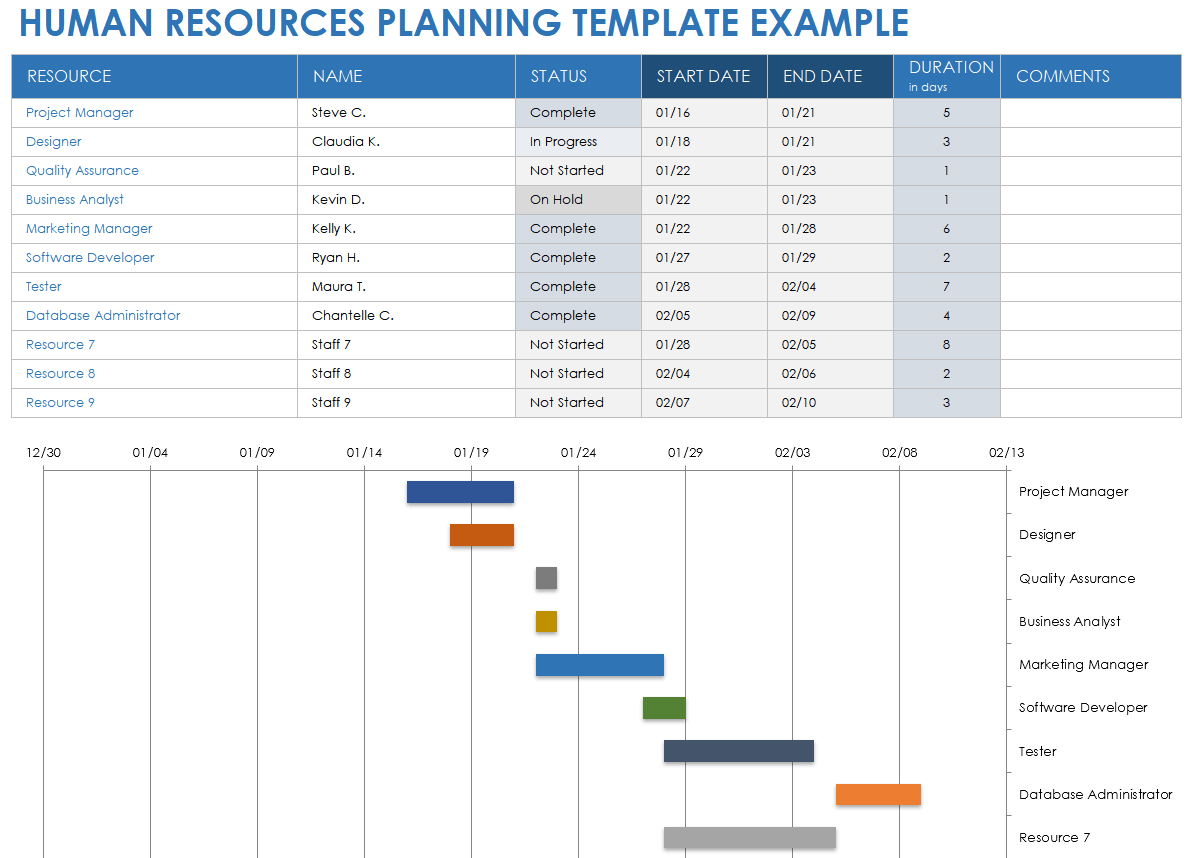
Download the Sample Human Resources Planning Template for Excel Download the Blank Human Resources Planning Template for Excel
Use this Gantt chart to ensure that your organization has all the required team members available to complete your next project. Follow the sample template for an Agile software development projec t, or enter your own data to manage human resources for any upcoming project or initiative.
Easily Track and Manage Your Projects with Gantt Charts in Smartsheet
Empower your people to go above and beyond with a flexible platform designed to match the needs of your team — and adapt as those needs change.
The Smartsheet platform makes it easy to plan, capture, manage, and report on work from anywhere, helping your team be more effective and get more done. Report on key metrics and get real-time visibility into work as it happens with roll-up reports, dashboards, and automated workflows built to keep your team connected and informed.
When teams have clarity into the work getting done, there’s no telling how much more they can accomplish in the same amount of time. Try Smartsheet for free, today.
Discover why over 90% of Fortune 100 companies trust Smartsheet to get work done.

Creating Gantt Chart for Research Proposal: 5 Comprehensive Tutorial!
Introduction.
A research proposal is an essential document that outlines the objectives, methodology, and timeline for a research project. It serves as a blueprint for the entire research process , guiding researchers in their work. One crucial aspect of a research proposal is the timeline, which helps researchers plan and manage their project effectively. To plan the timeline effectively, creating a Gantt chart is deemed important.

In this comprehensive tutorial, we will explore the importance of using a Gantt chart for your research proposal. We will discuss the components of this chart, how to create one for your research proposal, best practices for designing a Gantt chart, and common pitfalls to avoid. By the end of this tutorial, you will have a solid understanding of how to effectively utilize a Gantt chart to enhance the planning and execution of your research proposal.
Why You Need a Gantt Chart for Your Research Proposal
A Gantt chart is a visual project management tool that helps in planning, scheduling, and tracking the progress of specific tasks within a project. It was first introduced by Henry L. Gantt in the 1910s. It provides a visual representation of the timeline and tasks involved in your project, allowing you to effectively organize and track your progress.
One of the main reasons why you need a Gantt chart for your research proposal is that it helps you to clearly define and communicate your project timeline. By breaking down your research into specific tasks and assigning them to specific time periods, you can ensure that you have a realistic plan in place. Additionally, a this chart allows you to identify any dependencies between tasks. This means that you can determine which tasks need to be completed before others can begin, ensuring that your project progresses smoothly and efficiently.
Components of a Gantt Chart
A Gantt chart consists of several key components that help in visualizing and managing the timeline of a research proposal.
Project Activities
The left side of the chart lists the project activities or tasks that need to be completed. These activities are usually represented as a series of horizontal bars.
The top of the chart shows the time frame for the research proposal. It can be divided into days, weeks, months, or any other relevant time units depending on the duration of the project.
Dependencies
A Gantt chart shows the dependencies between different activities. Dependencies indicate the order in which tasks need to be completed. For example, if Task B depends on Task A, Task B cannot start until Task A is completed.
This chart also includes information about the resources required for each activity. This can include personnel, equipment, or any other necessary resources.
Milestones are significant events or achievements in the research proposal. They are represented as vertical lines on the chart and help in tracking progress and evaluating the overall timeline of the project.
By including these components in a Gantt chart, researchers can effectively plan and manage their research proposal, ensuring that tasks are completed in the right order and within the specified time frame.
How to Create a Gantt Chart for Research Proposal
Step 1: make a project table.
The first step in creating a Gantt chart is to make a project table. List all the activities that you plan to do in your research project. This can include tasks such as literature review, data collection, data analysis, and writing the final report. Make sure to include the start and end dates for each activity.
Step 2: Make a Bar Chart
Once you have your project table, you can create a bar chart. This chart will represent the timeline of your project. The horizontal axis of the chart represents the time period, while the vertical axis represents the activities.
Step 3: Add Data
Next, you need to add data to your bar chart. For each activity, determine the duration and dependencies. The duration is the amount of time it will take to complete the activity, while the dependencies are the activities that need to be completed before the current activity can start.
Step 4: Add Task Descriptions
To make your chart more informative, add task descriptions to each activity. This will help you and others understand what needs to be done for each task.
Step 5: Transform the Chart Into the Gantt Chart
Finally, transform your bar chart into a Gantt chart by adding the start and end dates for each activity. This will give you a visual representation of the project timeline and help you track the progress of your research proposal.
Best Practices for Designing a Gantt Chart
When designing this chart for your research proposal, it is important to follow some best practices to ensure its effectiveness and accuracy. Here are some key tips to consider:
Start with a Clear Project Scope
Before creating your Gantt chart, make sure you have a clear understanding of the scope of your research proposal. This includes identifying the objectives, deliverables, and timeline of your project. Having a clear project scope will help you accurately plan and schedule your tasks.
Break Down Tasks into Manageable Units
To create a detailed and comprehensive Gantt chart, it is essential to break down your research tasks into smaller, manageable units. This will allow you to allocate resources and estimate the duration of each task more accurately. Breaking down tasks also helps in identifying dependencies and potential bottlenecks.
Define Task Dependencies
Task dependencies are the relationships between different tasks in your research proposal. It is important to identify and define these dependencies in your Gantt chart. This will help you understand the sequence of tasks and ensure that they are scheduled in the correct order. For example, if Task B cannot start until Task A is completed, you need to represent this dependency in your Gantt chart.
Use Milestones to Track Progress
Milestones are significant events or achievements in your research proposal. They serve as markers to track progress and provide a sense of accomplishment. Incorporating milestones in this chart will help you monitor the overall progress of your project and stay on track.
Regularly Update and Revise the Gantt chart
A Gantt chart is a dynamic tool that should be regularly updated and revised throughout the duration of your research proposal. As tasks are completed or delayed, it is important to reflect these changes in the chart. This will help you stay informed about the current status of your project and make necessary adjustments to meet your goals.
Communicate and Collaborate with Team Members
If you are working on a research proposal with a team, it is crucial to communicate and collaborate effectively. Share the Gantt chart with your team members and ensure that everyone understands their roles and responsibilities. Regularly discuss the progress and any changes in the chart to keep everyone informed and aligned.
Avoiding Pitfalls In Gantt Chart Creation
Overloading the chart with details.
One of the most common mistakes when using a Gantt chart is including too much information or too many details, which can make the chart cluttered and difficult to read. It is important to remember that the purpose of this chart is to provide a visual representation of the project timeline and key tasks, not to include every single task or subtask.
Using the Gantt Chart as the Initial Project Plan
Another pitfall to avoid is using the Gantt chart as the initial project plan. While this chart can be a helpful tool for visualizing the project schedule, it should not be relied upon as the sole project planning tool. It is important to create a detailed project plan before creating this chart, which includes all the necessary tasks, dependencies, and resources.
Manually Creating the Gantt Chart
Additionally, it is important to avoid manually creating the Gantt chart. Manually creating this chart can be time-consuming and prone to errors. Instead, it is recommended to use project management software or online tools that have built-in Gantt chart functionality. These tools allow for easier creation, editing, and updating of the Gantt chart.
Ignoring Potential Mistakes or Delays
Another common mistake is not considering the possibility of mistakes or delays in the project timeline. When creating a Gantt chart, it is important to leave room for error and account for potential delays in the schedule. This can help prevent unrealistic expectations and allow for adjustments as needed.
Using the Gantt Chart for Resource Management
Lastly, it is important to avoid using the Gantt chart for resource management. While this chart can provide an overview of the project timeline, it is not designed to track resource allocation or availability. It is recommended to use separate resource management tools or spreadsheets to effectively manage and allocate resources for the project.
In conclusion, a well-designed Gantt chart can greatly enhance the planning and management of a research proposal. By effectively visualizing the project timeline and tasks, researchers can ensure that their proposal is feasible and achievable. With careful planning and regular updates, a Gantt chart can be a valuable tool for successful research proposal execution.
Leave a Comment Cancel reply
Save my name, email, and website in this browser for the next time I comment.
Related articles

5 Untold Best Tricks To Manage Your Thesis or Dissertations With Researchmate.net!

Finding Your Research Soul Mate: Connecting with Like-Minded Scholars Through Researchmate.net

Ultimate Guide to Project Management: The Key to Successful Project Delivery
13+ SAMPLE Gantt Chart Research Proposal in PDF | Excel

Gantt Chart Research Proposal | Excel
13+ sample gantt chart research proposal, what is a gantt chart research proposal, different uses of gantt charts, basic components of a gantt chart research proposal , how to write a gantt chart research proposal, what are some examples of a gantt chart research proposal, why is a gantt chart useful, what are the essential components of a gantt chart, what are the advantages and disadvantages of gantt charts.
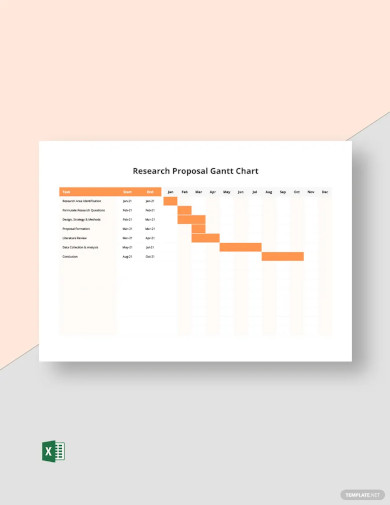
Research Proposal Gantt Chart Template
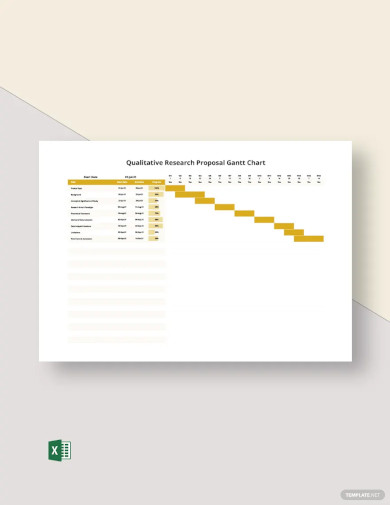
Qualitative Research Proposal Gantt Chart Template
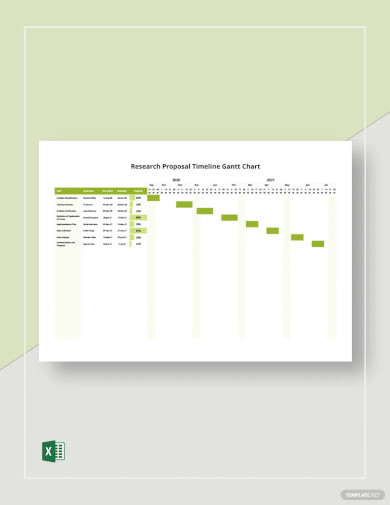
Research Proposal Timeline Gantt Chart Template
Gantt Chart Timeline Research Proposal
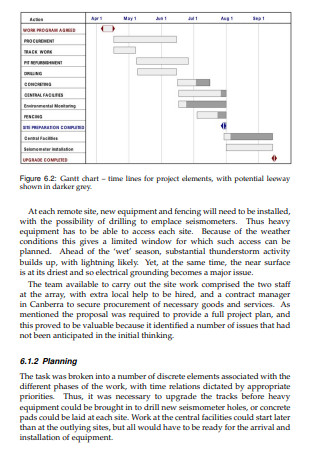
Gantt Chart Research Project Proposal
Sample Paper Research Management Proposal
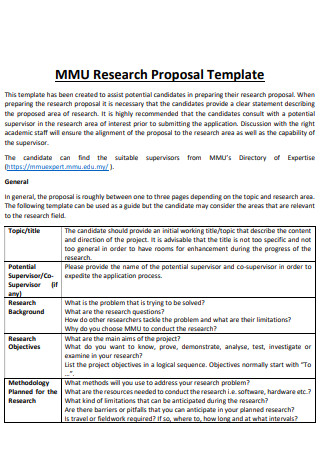
Gantt Chart Research Proposal
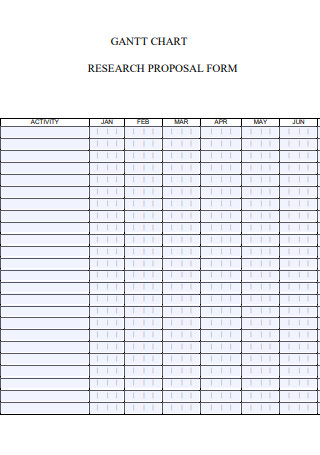
Gantt Chart Research Proposal Form
Market Research Proposal Gantt Chart
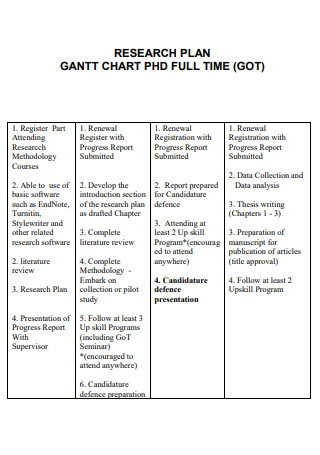
Gantt Chart Research Plan Proposal
Master Research Proposal Gantt Chart
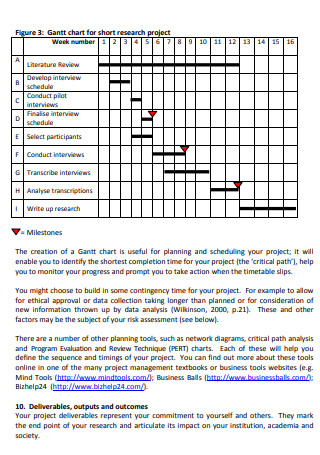
Gantt Chart Short Research Project Proposal
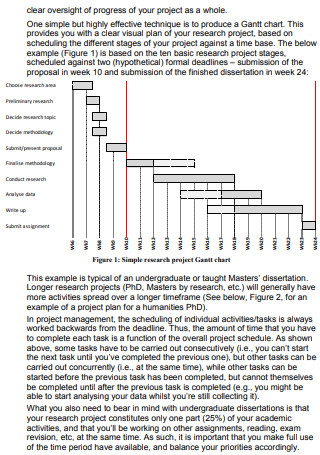
Research Project Gantt Chart Template
Proposal for Thesis Gantt Chart Template
1. business plan, 2. design project, 3. event planning, 4. software development, 5. social media, step 1: create a compelling cover page , step 2: identify the research problem, goals, objectives and desired outcomes, step 3: demonstrate the research activities and plans using a gantt chart, step 4: indicate the value, budget and other components of the research project, step 5: prepare the final draft, share this post on your network, you may also like these articles, title project proposal.
In this comprehensive guide, we will explore the essentials of crafting an effective Title Project Proposal. Whether you're applying for a grant, pitching a new project, or seeking approval…
25+ SAMPLE Construction Company Proposal in MS Word
Navigating the intricate world of construction demands a seasoned company with a proven track record. Our comprehensive guide on the Construction Company Proposal is your blueprint to understanding the…
browse by categories
- Questionnaire
- Description
- Reconciliation
- Certificate
- Spreadsheet
Information
- privacy policy
- Terms & Conditions
- (855) 776-7763
Knowledge Base
Survey Maker
All Products
Qualaroo Insights
ProProfs.com
- Get Started Free
FREE. All Features. FOREVER!
Try our Forever FREE account with all premium features!
15 Gantt Chart Examples for Project Management (an in-Depth Guide)
Expert Writer
David Miller, a seasoned writer at ProProfs with over a decade of diverse expertise, shares impactful insights on project management, leadership, and personal development through his blog.

Gantt Chart make tracking project progress much easier. But did you know that the use cases of these Gantt Chart Examples expand to multiple departments and not just project management?
You’d be surprised to know that I’ve got more than a dozen practical examples of these charts that can be applied in real life. Already curious?
Let’s hop right into the blog.
What Is a Gantt Chart?
“A Gantt chart is defined as a graphical representation of activity against time; it helps project professionals monitor progress.”
– Association for Project Management (APM)
Usually, it’s a bar chart showing a project’s schedule. It displays the project’s tasks, milestones, and dependencies along a horizontal timeline. Each task is represented by a horizontal bar that shows its start and end dates, duration, and completion percentage.
You can use different colors to show each task’s priority, status, or category. You can create a Gantt chart using dedicated project management software like ProProfs Project.
You can check this short video for a clearer understanding –
Watch: What Is Gantt Chart & Why Is It Important?
15 Powerful Examples of Gantt Chart
Project managers today consider Gantt charts more powerful than just a real-time progress tracker. I gathered input from HR heads, team leads, and project managers to create a list of the 15 best examples of Gantt charts.
Check them out below.
1. Project Management
Project management is the most common application of Gantt charts.
It is an excellent way to break down the work into manageable subtasks, assign responsibilities, and track progress, especially when you have a lot of tasks and dependencies.
In the image below, the timeline depicts the primary and crucial project information:
- The project’s name
- Start and end date of the project
- Tasks/subtasks and their duration
- Task dependency
The timeline view visually represents the project, making planning and allocating resources easier. The dependencies and milestones help you identify critical path tasks and potential bottlenecks and adjust your schedule accordingly.
2. Human Resource
As a human resource (HR) professional, you understand how there are so many things on your plate, like –
- Assessing current staff requirements
- Employee onboarding
- Recruitment process
- Employee offboarding
- Payroll management
- Managing/updating company policies
- Maintaining employees’ records
- Taking care of employee training and development
Gantt chart templates for HR track candidate interviews, onboarding, training, and more. It can provide an overview of the recruitment process, including the timelines for candidate sourcing, interviewing, and hiring.
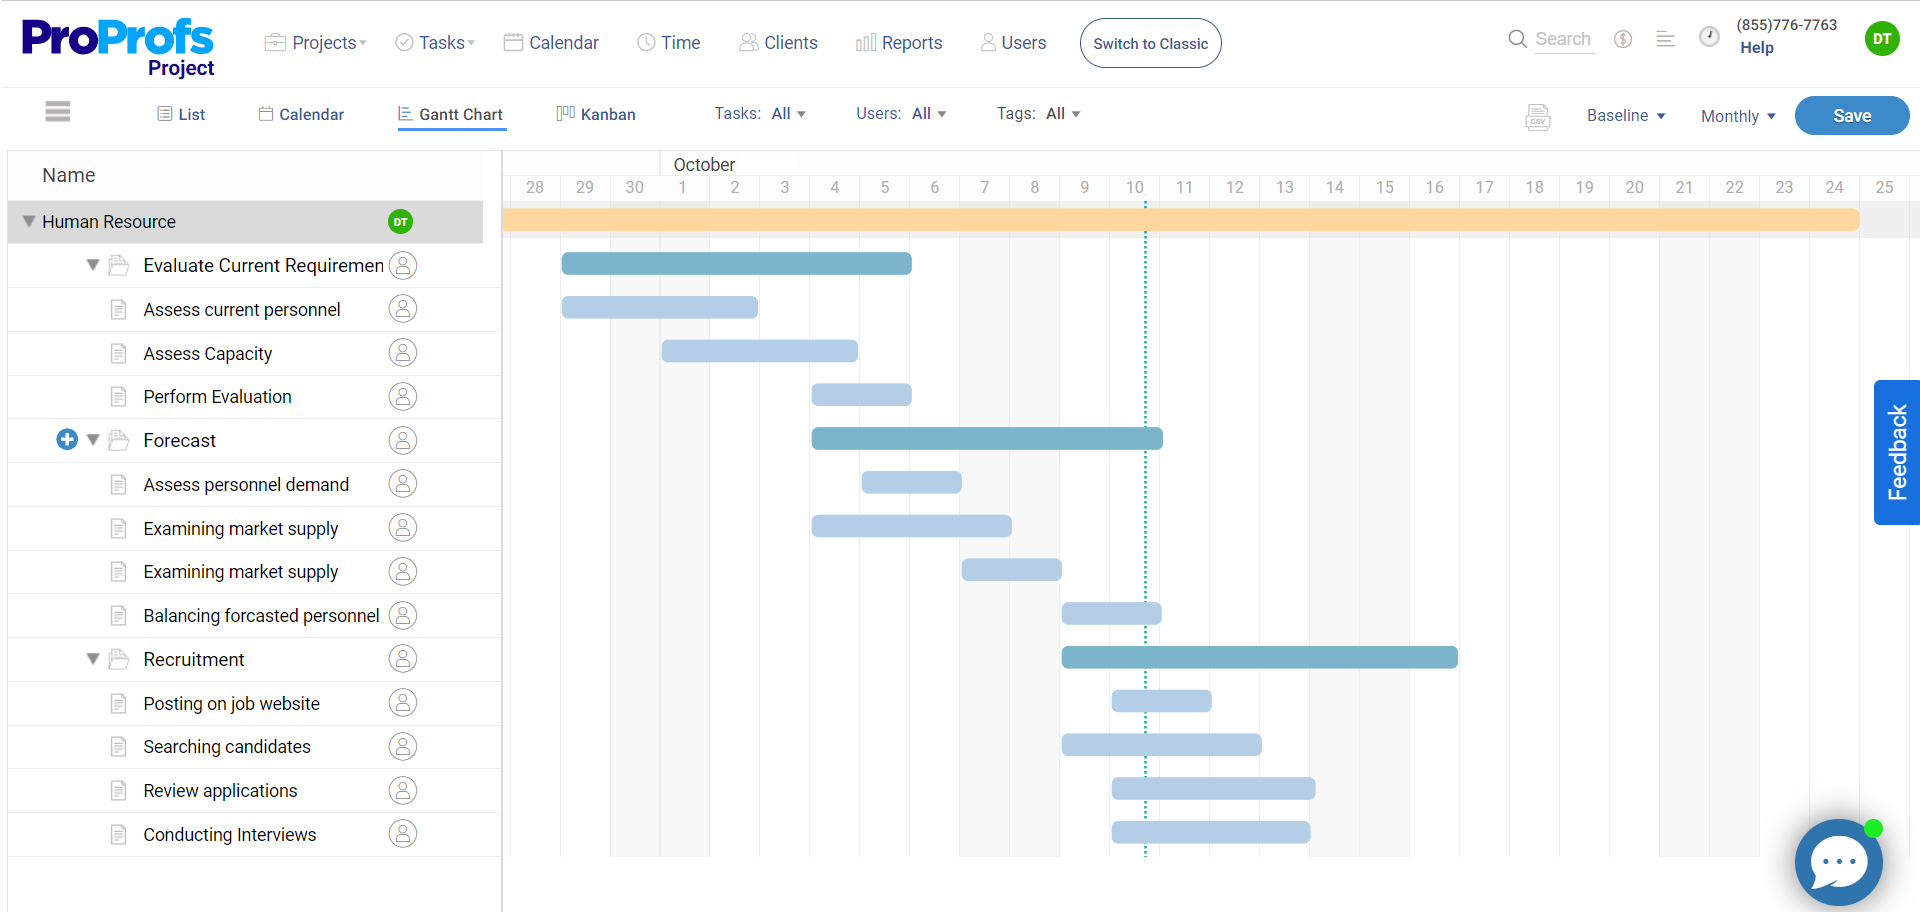
For instance, a Gantt chart can display the sequential steps in the hiring process, from posting job ads to conducting interviews and making offers – even making managing remote candidates

Read Customer Success Story
3. Business Plan
For budding entrepreneurs, creating a business plan involves numerous moving parts, from market research to financial forecasting.
A Gantt chart can break down the monumental task of launching a business into manageable pieces. It could outline the journey from conceptualization, securing funding, and product development to market entry, helping you track progress against milestones and adjust plans as the business environment changes.
For instance, in the below example of the Gantt Chart, you can see that before researching the market and competitors, you need to define the business vision and perform a SWOT analysis.
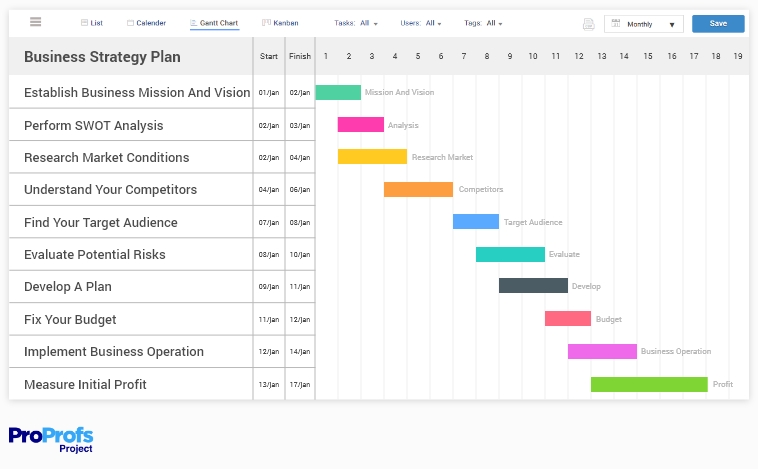
4. Sales Process
Working as a sales representative involves various challenges – cold calling , contacting potential customers, making follow-up calls, delivering sales presentations, sending emails, and conducting video conferences. It’s a demanding job.
Losing track of any of these can derail the entire team. But luckily, with Gantt charts, that won’t happen.
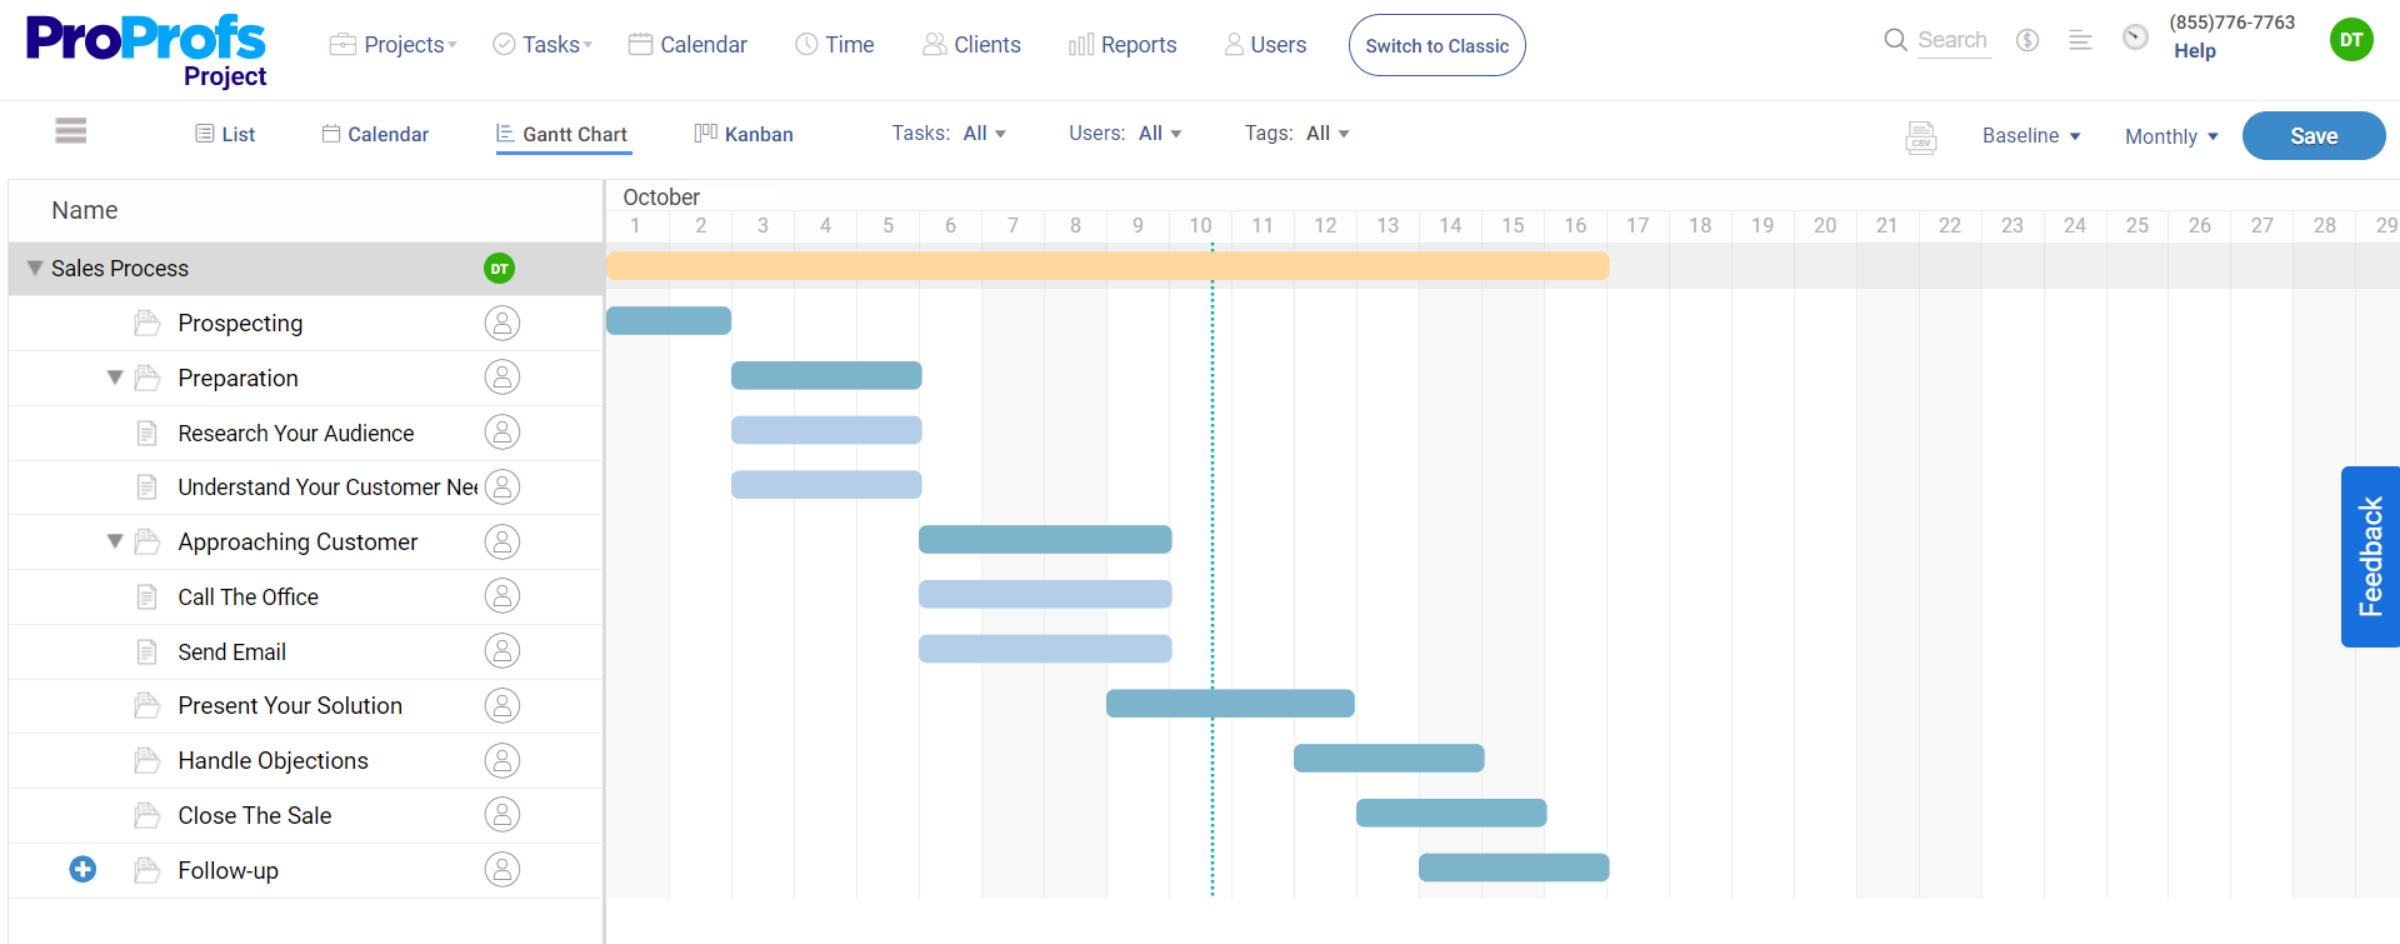
Sales teams can use Gantt charts to map out the sales cycle for key accounts, from initial contact through negotiation, closing, and post-sale follow-up. It helps identify potential bottlenecks, adjust resources, and optimize the sales funnel by monitoring lead conversion rates, sales targets, and other critical KPIs.
5. Marketing
In marketing, Gantt chart examples are not that common. But in reality, it’s invaluable for planning campaigns across different channels.
It can help you coordinate the launch of a new advertising campaign, ensuring that creative development, media buying, and campaign analysis are completed in a timely and synchronized manner.
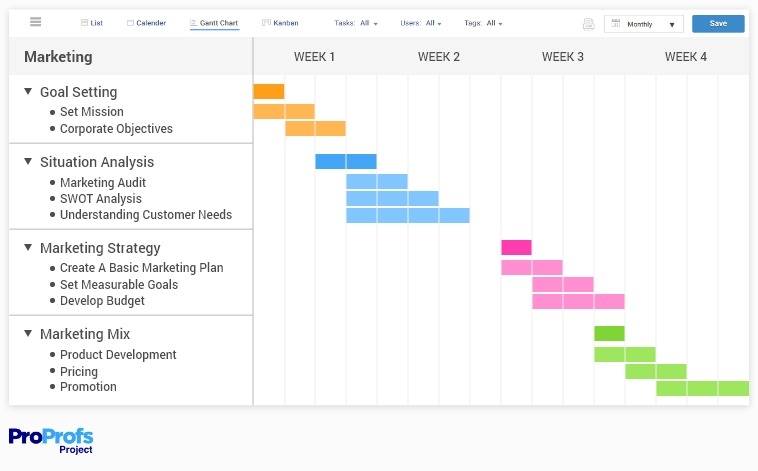
Gantt charts also let you visualize the overlap between tasks such as content creation, ad buying, and public relations efforts – ensuring that all elements of a campaign are coordinated and executed on time.
6. Product Management
For product managers, Gantt charts provide a visual roadmap for product development, from ideation through design, testing, and launch. It details phases such as market research, prototype development, user testing, and production. Such a visual overview of the product development lifecycle helps you easily allocate resources, set milestones, and track progress.
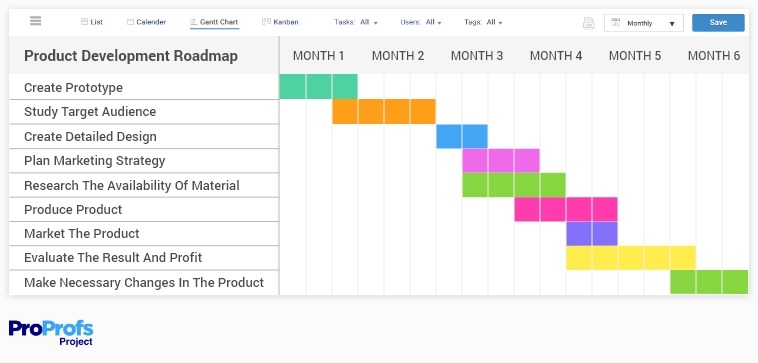
Media and publishing projects, such as the production of a film, magazine, or digital content series, can be intricately planned with Gantt charts with Gantt chart examples. These charts help schedule and track various stages of content creation, editing, and distribution – ensuring that deadlines are met and content is released as planned.
It’s particularly useful in managing cross-functional teams that include writers, designers, and marketers – providing a common timeline that syncs everyone’s efforts toward the timely completion of media content.
8. Construction
Construction projects are complex, involving numerous subcontractors, regulatory approvals, and material deliveries. Can a Gantt chart help here? You bet it does.
With Gantt charts, you can break down the project into phases such as design, permitting, construction, and inspection – offering a clear timeline for each. You can also highlight dependencies, such as the need to complete the foundation before framing begins.
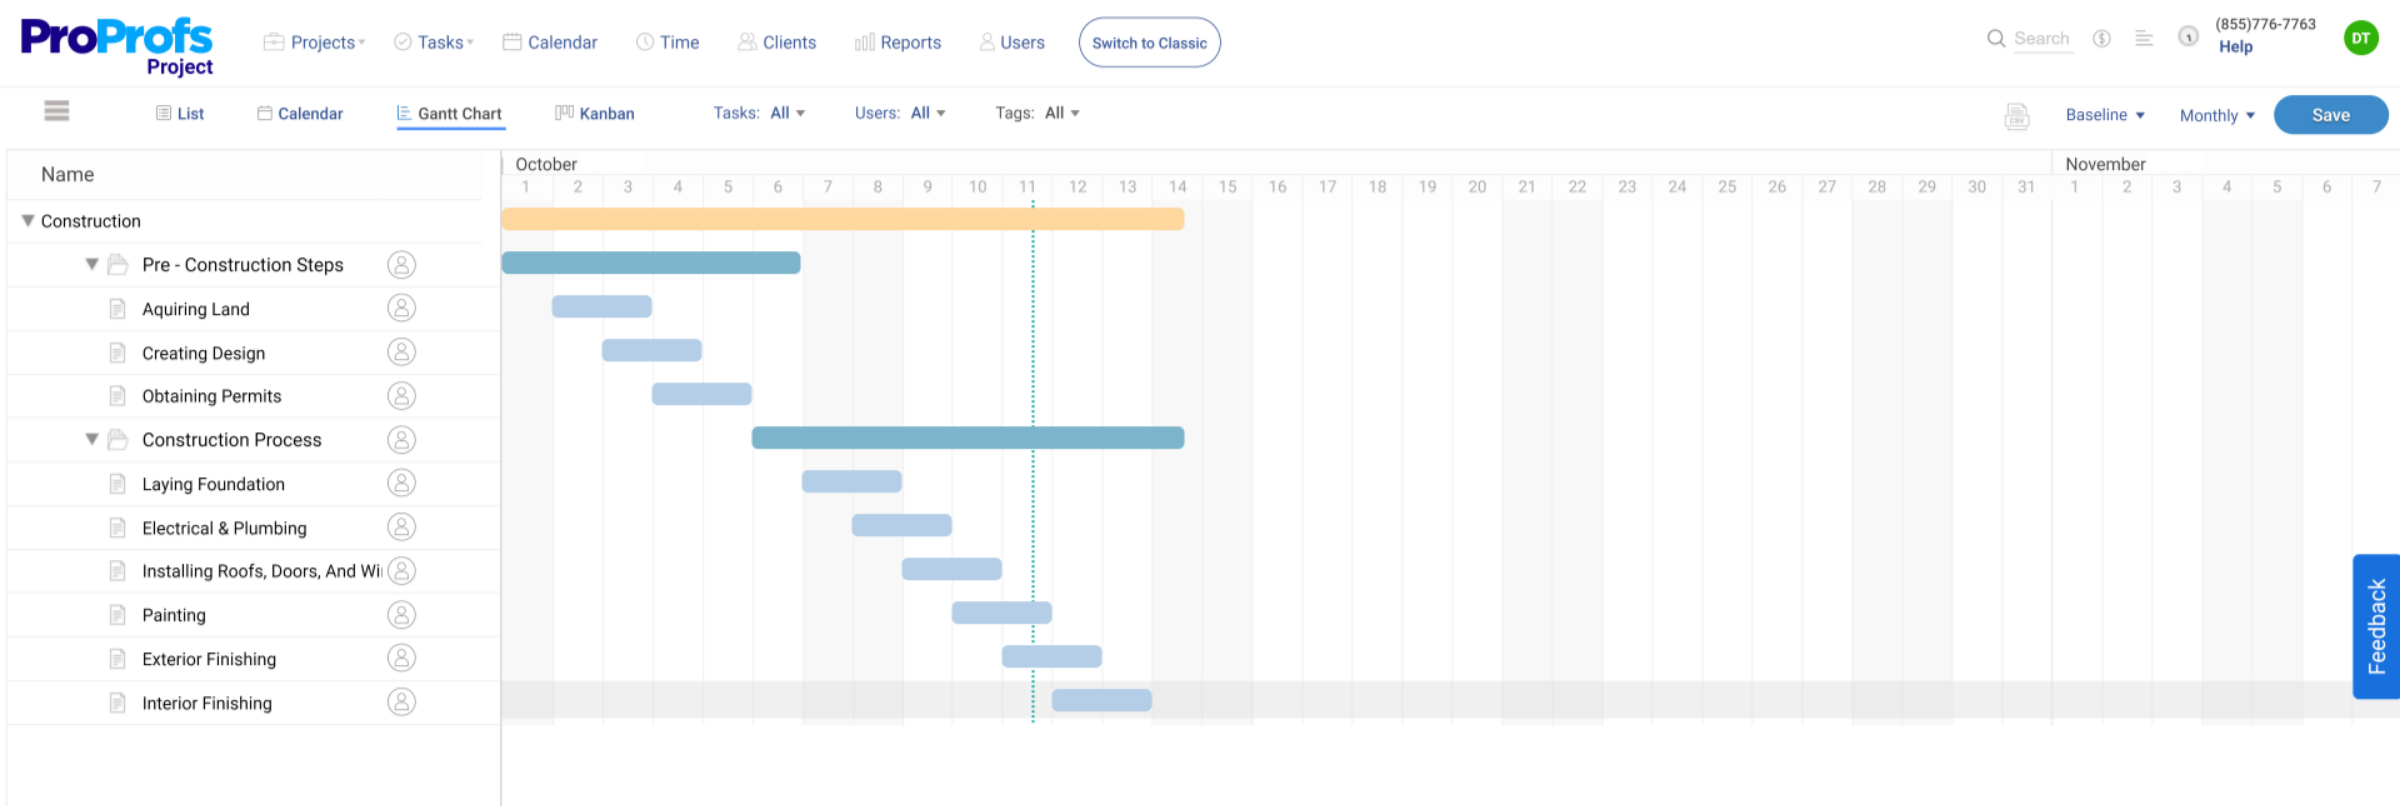
This level of organization is critical for keeping construction projects on schedule and within budget.
Looking for construction project management software solutions?
9. Social Media
Being part of a social media team is not for the faint-hearted (brutally honest review) .
You have to manage posts, create content calendars, track campaign launches, check why engagement rates are falling, and more. But all this chaos can be silenced (to some extent) when you maintain a consistent posting schedule across platforms. How?
Well, social media managers say Gantt charts greatly help them in this.
Using Gantt charts, you can plan posts and campaigns across different platforms, ensuring a strategic approach to content delivery. It also aids in allocating resources for content production and monitoring, optimizing the impact of social media efforts.
10. Event Planning
Event planning is an intricate tale of logistics, from venue booking to vendor coordination and guest management.
A Gantt chart provides event planners with a visual checklist of every task and deadline, ensuring nothing is overlooked. Whether a corporate conference or a charity gala, the chart helps manage the myriad details, guaranteeing a successful event.
For example, in the image given below, you can see that with the help of a Gantt chart, the event is divided into numerous tasks like budgeting, setting dates, and organizing decorations.
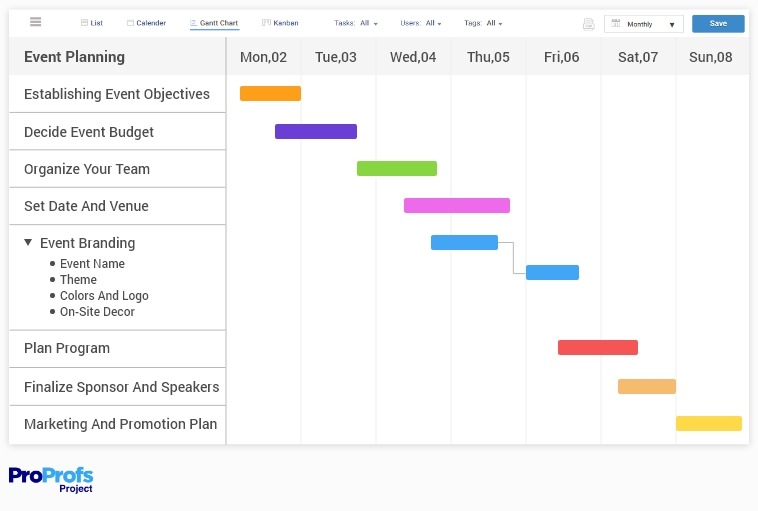
11. Consultants
If you are a consultant working on client projects , Gantt charts can help you outline project phases, deliverables, and deadlines – providing a clear roadmap for the client.
This helps communicate the project plan clearly to clients, setting realistic expectations for project completion. It also enables you to juggle multiple client projects efficiently, ensuring each project receives the attention it needs without compromising quality or timelines.
12. Design Project
A Gantt Chart helps track creative processes, review cycles, and implementation stages in creative projects such as website design or branding campaigns. Most tasks in these projects are interdependent.
For instance, if you’re designing a new website, you’ll most likely follow a well-established procedure:
- Create a wireframe for the user interface
- Make a mockup in Photoshop
- Create a webpage
- Test Website
With the help of a Gantt chart, your design team can track all these steps in one place. Here’s an example –
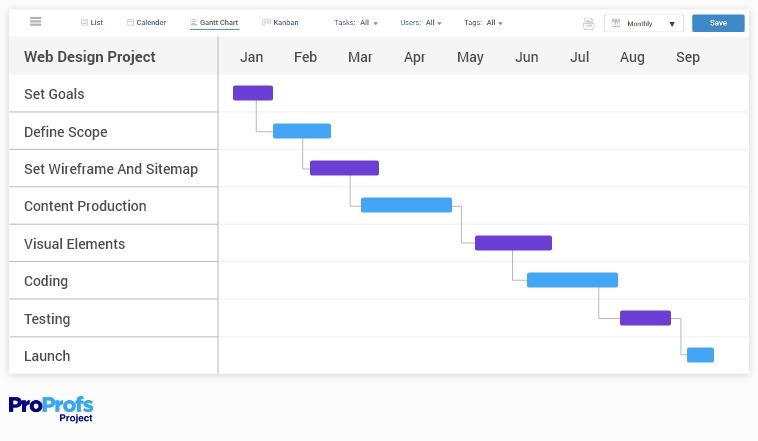
13. Mobile App Development
Statista says – “In 2025, the number of mobile users worldwide is projected to reach 7.49 billion .”
This shows how essential it is to create a mobile app for almost all businesses. Using a Gantt chart, you can plan out all the steps needed to develop your app. It provides a visual representation of the agile development process, including development sprints, feature implementation, testing, and launch.
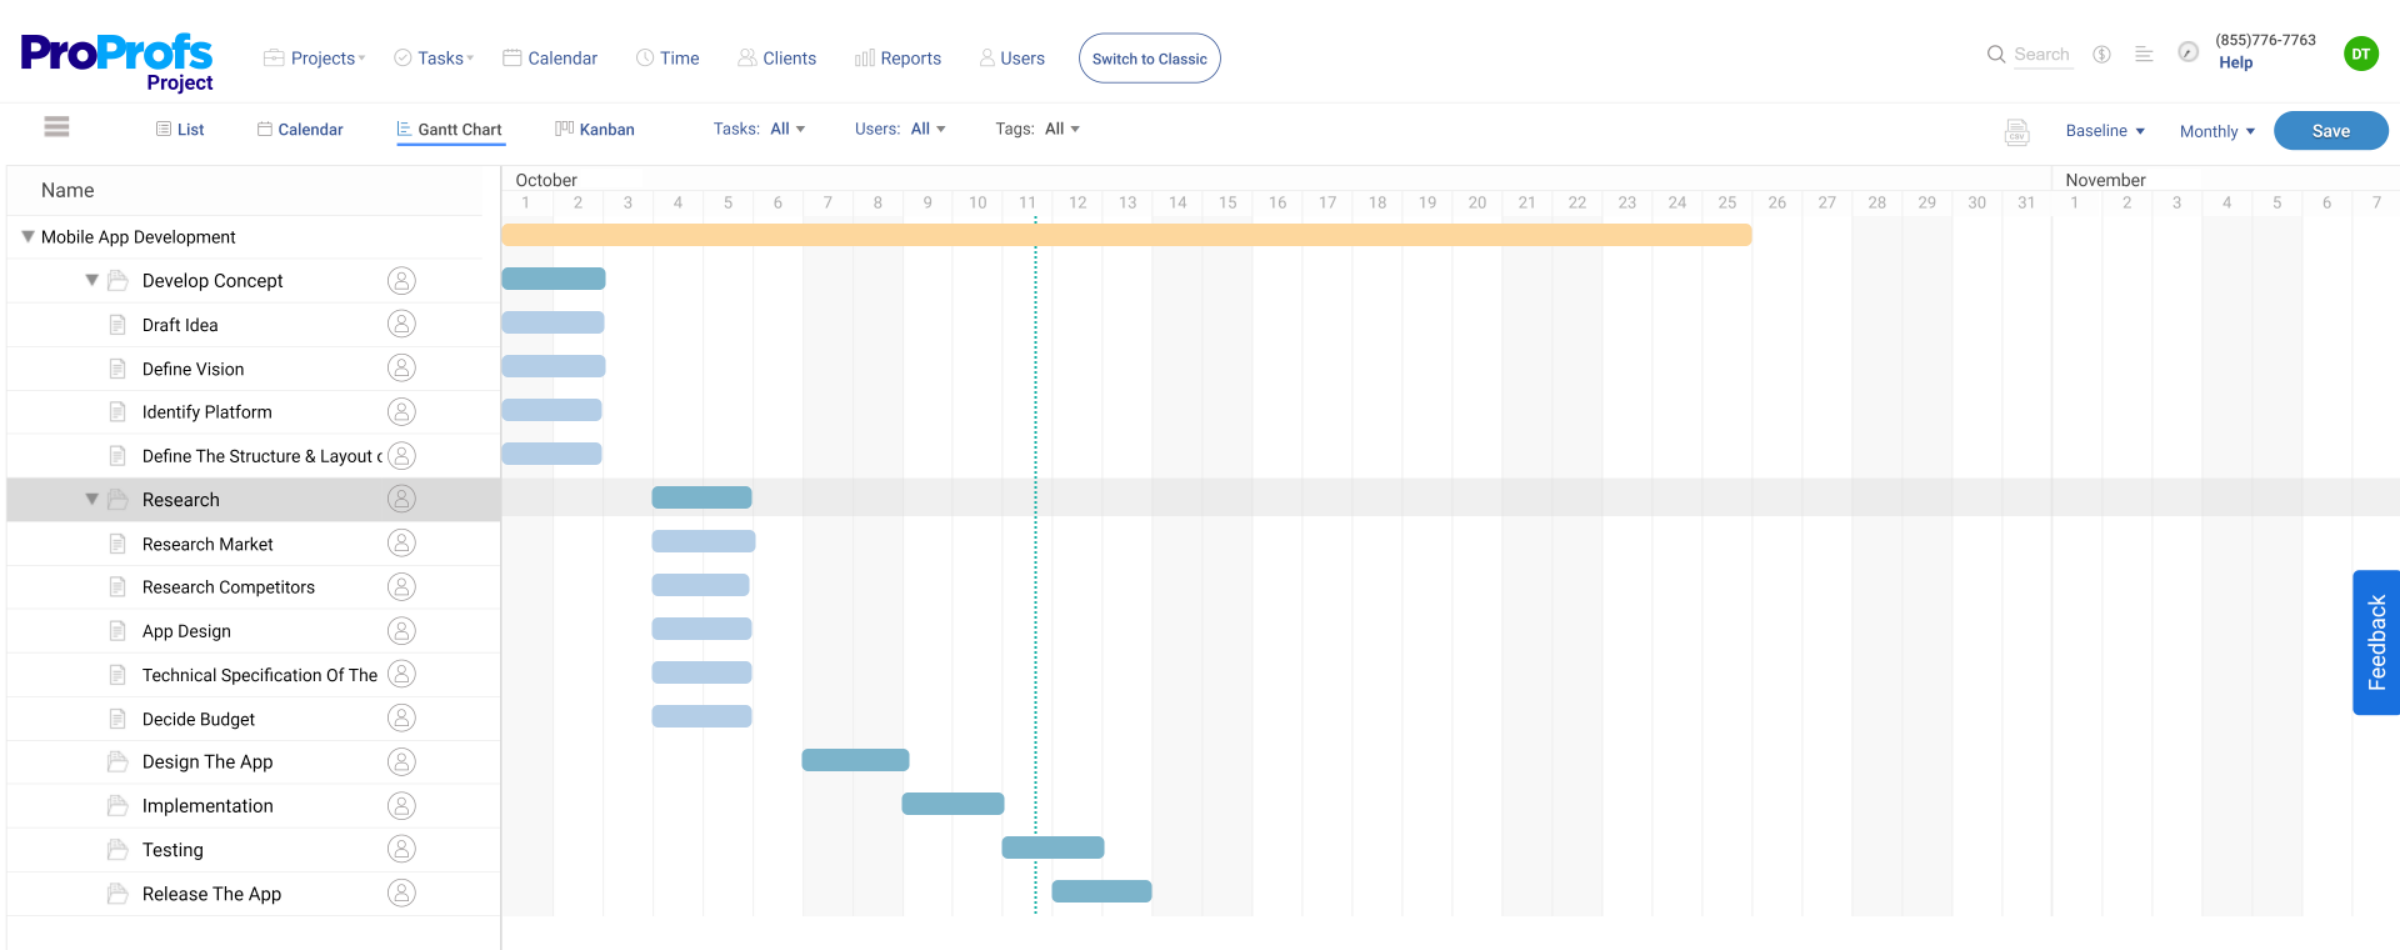
It also boosts your likelihood of finishing each task accurately and efficiently. After all, the goal is to ensure a successful app launch, and this method helps you achieve that goal.
14. Email Marketing
Much like social media, email marketing requires robust efforts to plan and execute campaigns efficiently. There’s a lot to track – which content is performing well, which is not, dates, times, contacts, subjects, and more.
The idea to use a Gantt chart here is to remain on top of everything. Otherwise, failing to monitor all email-related tasks and contacts could result in missed sales opportunities and lost valuable connections and leads…something like this –
15. Software Development
Let’s be honest about this: Gantt charts are a dream come true for software development teams. Why?
Well, these charts facilitate the tracking of version releases, feature developments, testing cycles, and bug-fixing efforts – aligning the development team and stakeholders around a common timeline.
Using Gantt Chart in software development projects, you can oversee –
- Project management tasks
- Planning of activities
- Development
- Implementation
- Deployment and maintenance
What Are the Parts of a Gantt Chart?
Understanding the key components that make up a Gantt chart can help you utilize them more effectively. Let’s check them out.
- Task List: This is a list of all the tasks or activities that need to be completed for the project.
- Milestones: Key milestones or major project checkpoints are marked on the chart as significant events.
- Dependencies: Arrows or lines are used to show task dependencies , indicating which tasks need to be completed before others can start.
- Timeline : A horizontal timeline represents the project duration, with each task displayed as a bar along the timeline.

Apart from the four main parts of a Gantt chart, there are also some other parts that you should know about –
- Bars: Each task is represented by a bar on the chart, with the length of the bar indicating the duration of the task.
- Duration: The length of each task bar represents the duration of that task, helping to visualize the time required for completion.
- Percent Complete: This indicates the progress or completion percentage of each task, providing an overview of the project’s progress.
- Resources: The Gantt chart can also show the allocation of resources to each task, whether it’s team members, equipment, or materials.
- Critical Path: The critical path is the sequence of tasks that determine the overall project duration. It is often highlighted or identified on the Gantt chart to help with project scheduling .
- Baseline : It refers to the initial plan or schedule against which the progress and deviations are measured. It helps track any changes and their impact on the project timeline.
- Notes or Comments: Gantt charts may include notes or comments section to provide additional information or details about specific tasks or milestones.
- Legend: A legend or key is usually included to explain the symbols or colors used in the chart, making it easier to understand and interpret.
How to Make a Gantt Chart?
Creating a Gantt chart is possible through Microsoft Excel, PowerPoint, or Word. However, the easiest way to create these is by using specialized Gantt chart tool . Here’s a step-by-step guide to help you get started –
- Access Your Project: Select the project for which you want to create a Gantt chart on your dashboard.
- Set Up Tasks and Milestones: Enter your project tasks, sub-tasks, and milestones, along with their start and end dates.
- Adjust Timelines: You can visually adjust the timelines of each task by dragging the edges of the bars in the Gantt chart.
- Identify Dependencies: Link tasks dependent on each other to see how changes in one task’s timeline affect others.
- Monitor Progress: The Gantt chart will help you track the progress of tasks, showing how much work is completed and what still needs to be done.

What Are the Advantages and disadvantages of Using Gantt Charts?
I know you’re probably wondering – Pros are okay, but why would there be cons of using Gantt charts? Don’t they have a lot of use cases?
Well, like any tool, even their are advantages and disadvantages of gantt charts . Even if the cons aren’t deal-breaking, it’s better to be aware. Here are some of the most common pros and cons –
- High-Level Overview: They visually represent the project timeline, making it easier to understand the sequence and duration of tasks.
- Resource Management: Gantt charts help allocate resources effectively and manage time efficiently.
- Tracking Progress: They allow for real-time tasks, benchmarks, and workflow tracking.
- Illustrating Dependencies: They clearly show how tasks overlap and how the start of one task may depend on the completion of another.
- Complexity: Gantt charts can become too complex and difficult to interpret as projects grow.
- Information Overload: Gantt charts can overwhelm you with too much information if poorly designed.
- Maintenance: They require constant updates to reflect the project’s true status, which can be time-consuming.
Who Uses Gantt Charts?
Gantt charts are a versatile project management tool used across various industries to plan, coordinate, and track progress. Here are some of the different departments that utilize Gantt charts in their day-to-day work:
- Consulting Agencies: Consultants use Gantt charts to manage client engagements, track deliverables, and ensure that projects stay on schedule.
- Engineering Firms: Gantt charts provide a clear overview of tasks, dependencies, and deadlines, enabling project managers to allocate resources and adjust plans.
- Software Development: Gantt charts help create project roadmaps, manage the software development life cycle, and track progress. They are useful for breaking down complex software projects into manageable tasks and visualizing the timeline of development activities.
- Event Planning: With Gantt charts, event planners get help in scheduling activities, assigning responsibilities, and ensuring that all aspects of the event are prepared in time.
- Human Resources: HR departments use Gantt charts to organize tasks related to recruitment, onboarding, training, and other HR initiatives.
- Marketing Teams: Gantt charts help in visualizing tasks, setting deadlines, and tracking the progress of marketing initiatives.
- Manufacturing: In manufacturing, Gantt charts are used to plan production schedules, track the manufacturing process, and ensure the timely delivery of products. They help map out the product development cycle and manage the workflow.
- Construction Firms: Gantt charts in construction help visualize project timelines, track the progress of tasks, and manage resources effectively.
Create Effective Gantt Charts That Reduce Your Workload
Gantt charts are undoubtedly an indispensable tool if you manage projects with multiple tasks, assignees, dependencies, etc. It can help you make scheduling, planning, and tracking projects easier than before.
But there’s a prerequisite – you must have reliable Gantt chart software.
That’s largely because creating these charts on spreadsheets or Word documents is a hassle. With a software solution, there’s hardly any sweat.
One such popular software that offers an intuitive Gantt chart maker is ProProfs Project . It’s an easy-to-use project management software you may have heard before. You can give it a test drive – it’s completely free, thanks to the freemium plan.
Learn More About Gantt Charts
What is a gantt chart used for in project management.
A Gantt chart is used in project management to visualize project schedules. It shows tasks, their start and end dates, and dependencies, helping teams plan, track progress, and allocate resources effectively.
What are some of the best practices for creating an effective Gantt chart?
To create an effective Gantt chart, consider the following best practices –
- Get a reliable Gantt chart software tool.
- Define the project scope and break it down into manageable tasks.
- Identify all necessary tasks and organize them in a logical sequence.
- Set realistic start and end dates for each task, considering dependencies.
- Assign tasks to team members with clear responsibilities.
- Establish milestones for critical checkpoints throughout the project.
- Monitor progress regularly and update the Gantt chart to reflect changes.
- Communicate the Gantt chart with all stakeholders to ensure alignment and transparency.
Can I make a Gantt chart online?
Yes, you can make a Gantt chart online.
For that, you will need a Gantt chart maker tool . Usually, all major project management software solutions like ProProfs Project have a tool that allows you to create Gantt charts and use them to track project progress.
What does Gantt stand for?
“Gantt” refers to Henry Gantt, an American mechanical engineer credited with developing the Gantt chart in the 1910s. A Gantt chart is a type of bar chart that represents a project schedule and is widely used in project management to track tasks and timelines.
About the author
David Miller
David Miller, an Expert Writer at ProProfs, has over 12 years of experience as a consultant and business strategist. His narratives on project management, leadership, and personal development are featured on platforms like Jeff Bullas, HR.com, and eLearningIndustry. David mentors & contributes innovative insights to ProProfs’ blogs. Connect with him on LinkedIn.

Top 12 Gantt Chart Software & Tools for Real-Time Tracking
What is a Gantt Chart & How to Use Gantt Charts for Project Planning

Advantages and Disadvantages of Using Gantt Chart

Must-Have Project Management Software Features Explained

Gantt Chart Dependencies: Types and Importance
How to Make a Gantt Chart (Step-by-Step Guide for Beginners)
- TemplateLab
- Project management
Gantt Chart Templates
16 free gantt chart templates (excel, powerpoint, word).
If you’ve got experience in project management, you’ve probably heard of a Gantt chart. In the early 20th century, Henry Gantt developed the Gantt chart to help with organizing project data by showing accomplished work in comparison to anticipated activity.
Gantt charts are an essential tool used to arrange project tasks on a visual timeline. This makes it simple for project, program, and portfolio managers to sketch out project plans and major milestones. Gantt charts are used for a variety of other things, including resource management, scheduling, tracking, and planning.
Table of Contents
- 1 Gantt Chart Templates
- 2 What is a Gantt Chart Template
- 3 How is a Gantt Chart Used
- 4 Gantt Chart Samples
- 5 What is a Gantt Chart Used For
- 7 How To Create Your Own Gantt Chart Templates
- 8 What to Include in Your Gantt Chart
- 9 Gantt Chart Examples
- 10 When Should You Use a Gantt Chart Template
- 11 How To Create an Excel Gantt Chart Template
- 12 How to Create a Gantt Chart in Google Sheets
- 13 How to Create a Gantt Chart template in Word
- 14 Conclusion
Since its creation in the early 1910s Gantt charts have been used for over a century. In this article, we’ll explain how a robust Gantt chart tool functions and why so many project teams employ them.
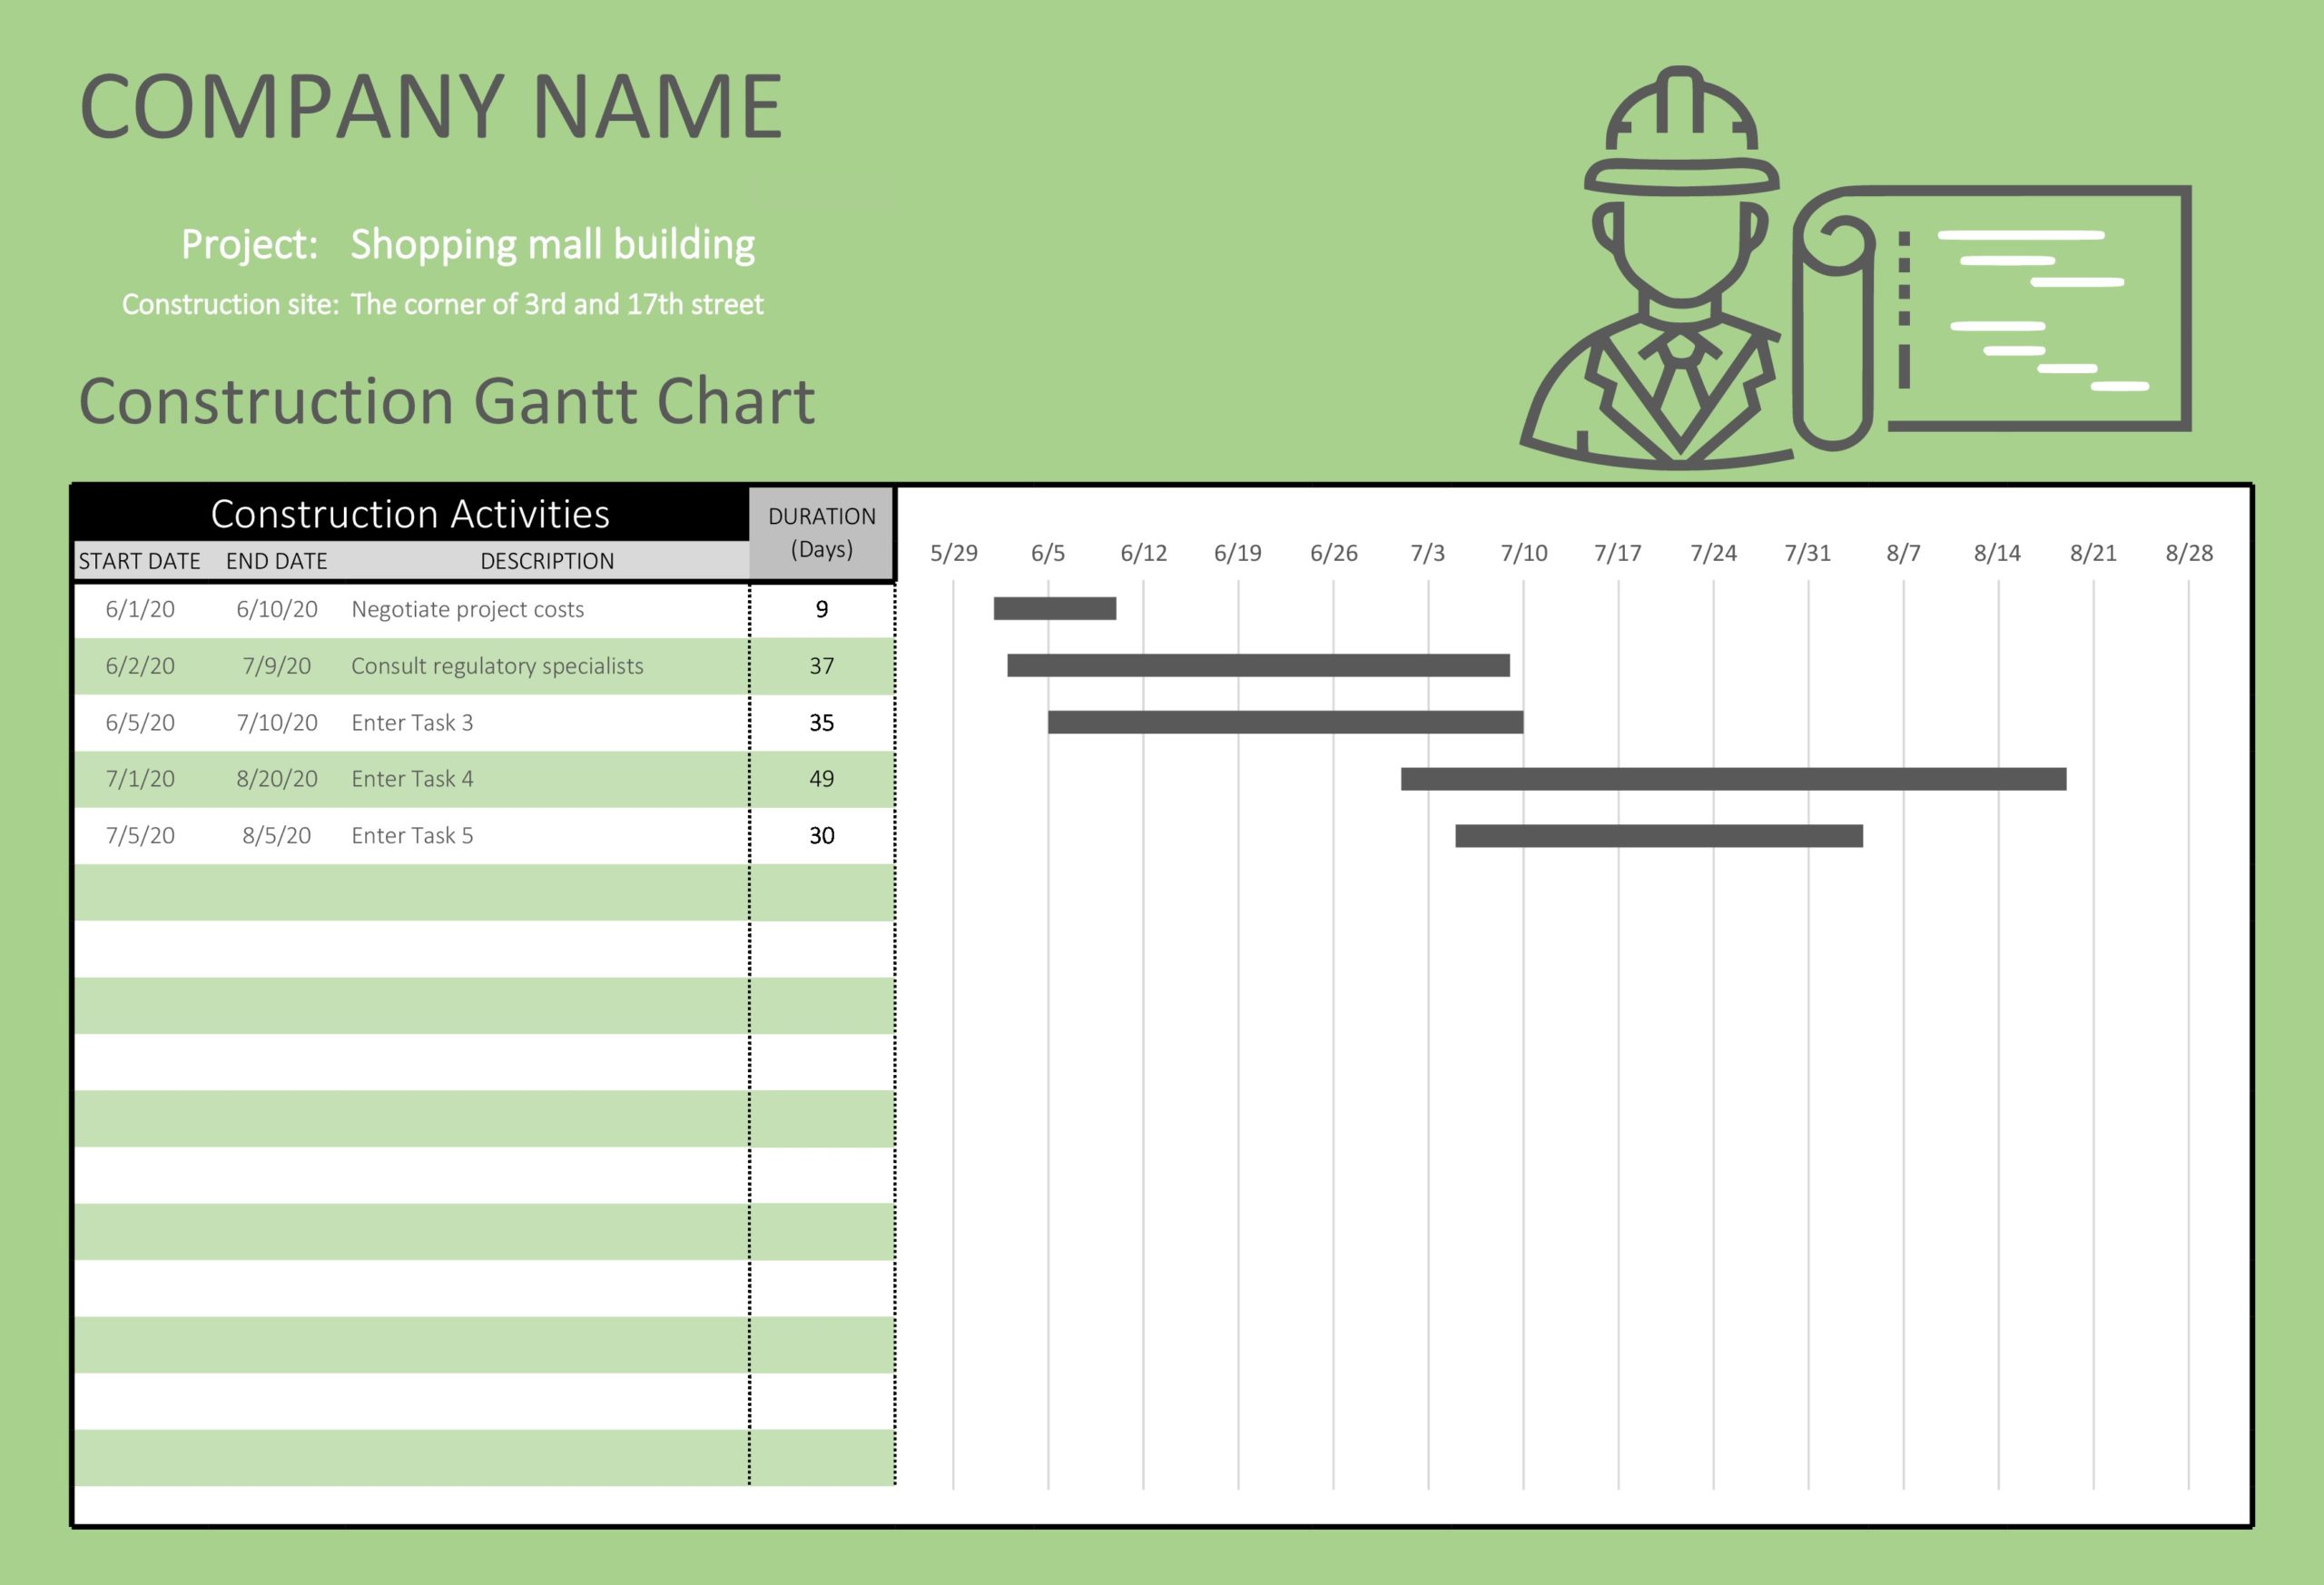
What is a Gantt Chart Template
A Gantt chart template is a graphic representation of activities that aid project managers in keeping track of development.
These charts show a series of horizontal lines that demonstrate the quantity of work or production that is completed within a specific time frame. These horizontal bars that include timelines and tasks are also known as Gantt bars. This is due to their similarity to a stacked bar chart.
A Gantt chart template displays the task’s start and end dates, dependencies, scheduling, deadlines, percentage of the task that has been completed in each stage, and the task owner.
After tasks have been specified using a work breakdown structure, Gantt charts are often used throughout projects, programs, and portfolios to represent anticipated activity against the time it takes to complete the activity.
You can use a simple Gantt chart template to assign tasks to each member of the team, establish time limits, automatically calculate costs, and keep track of progress in real-time.
The best attribute of a Gantt chart is that it can be used in conjunction with a different project plan template like a Kanban board, real-time project dashboards, timesheets, and tools for team collaboration.
When there is a big team and numerous stakeholders, a visual representation of the timeline of a project is helpful to keep work on schedule. Gantt chart templates make it easy to quickly assess and track project progress.
Some of the key benefits of a Gantt chart template:
- Gives a visual representation of the entire project including project milestones.
- Provides a clear critical path of the project schedule and deadlines for each milestone.
- Links relationships and dependencies among different activities.
- Provides a clear project timeline, phases, and other tasks.
Gantt chart integration in other project management tools provides managers with insights into team workloads, as well as existing and future availability, enabling more precise scheduling.
How is a Gantt Chart Used
The idea of a Gantt chart template is to list the jobs that need to be done and the order in which the task list needs to be completed. This will assist you in finding specific tasks that can be completed simultaneously or one after the other.
Combining this with the project’s resources will allow you to examine the relationship between the project’s scope (size and timeline), cost (amount of resources), and time frame (getting the job done). The project manager can observe how modifying the overall project scope or adding more resources would affect the deadline.
Project managers also need to be aware of all the individual tasks necessary to accomplish the project, an estimation of how long each task will take, and which activities are interdependent.
Compiling this data aids a project manager in concentrating on the crucial elements and attempting to define a reasonable timeline for completion.
Gantt Chart Samples
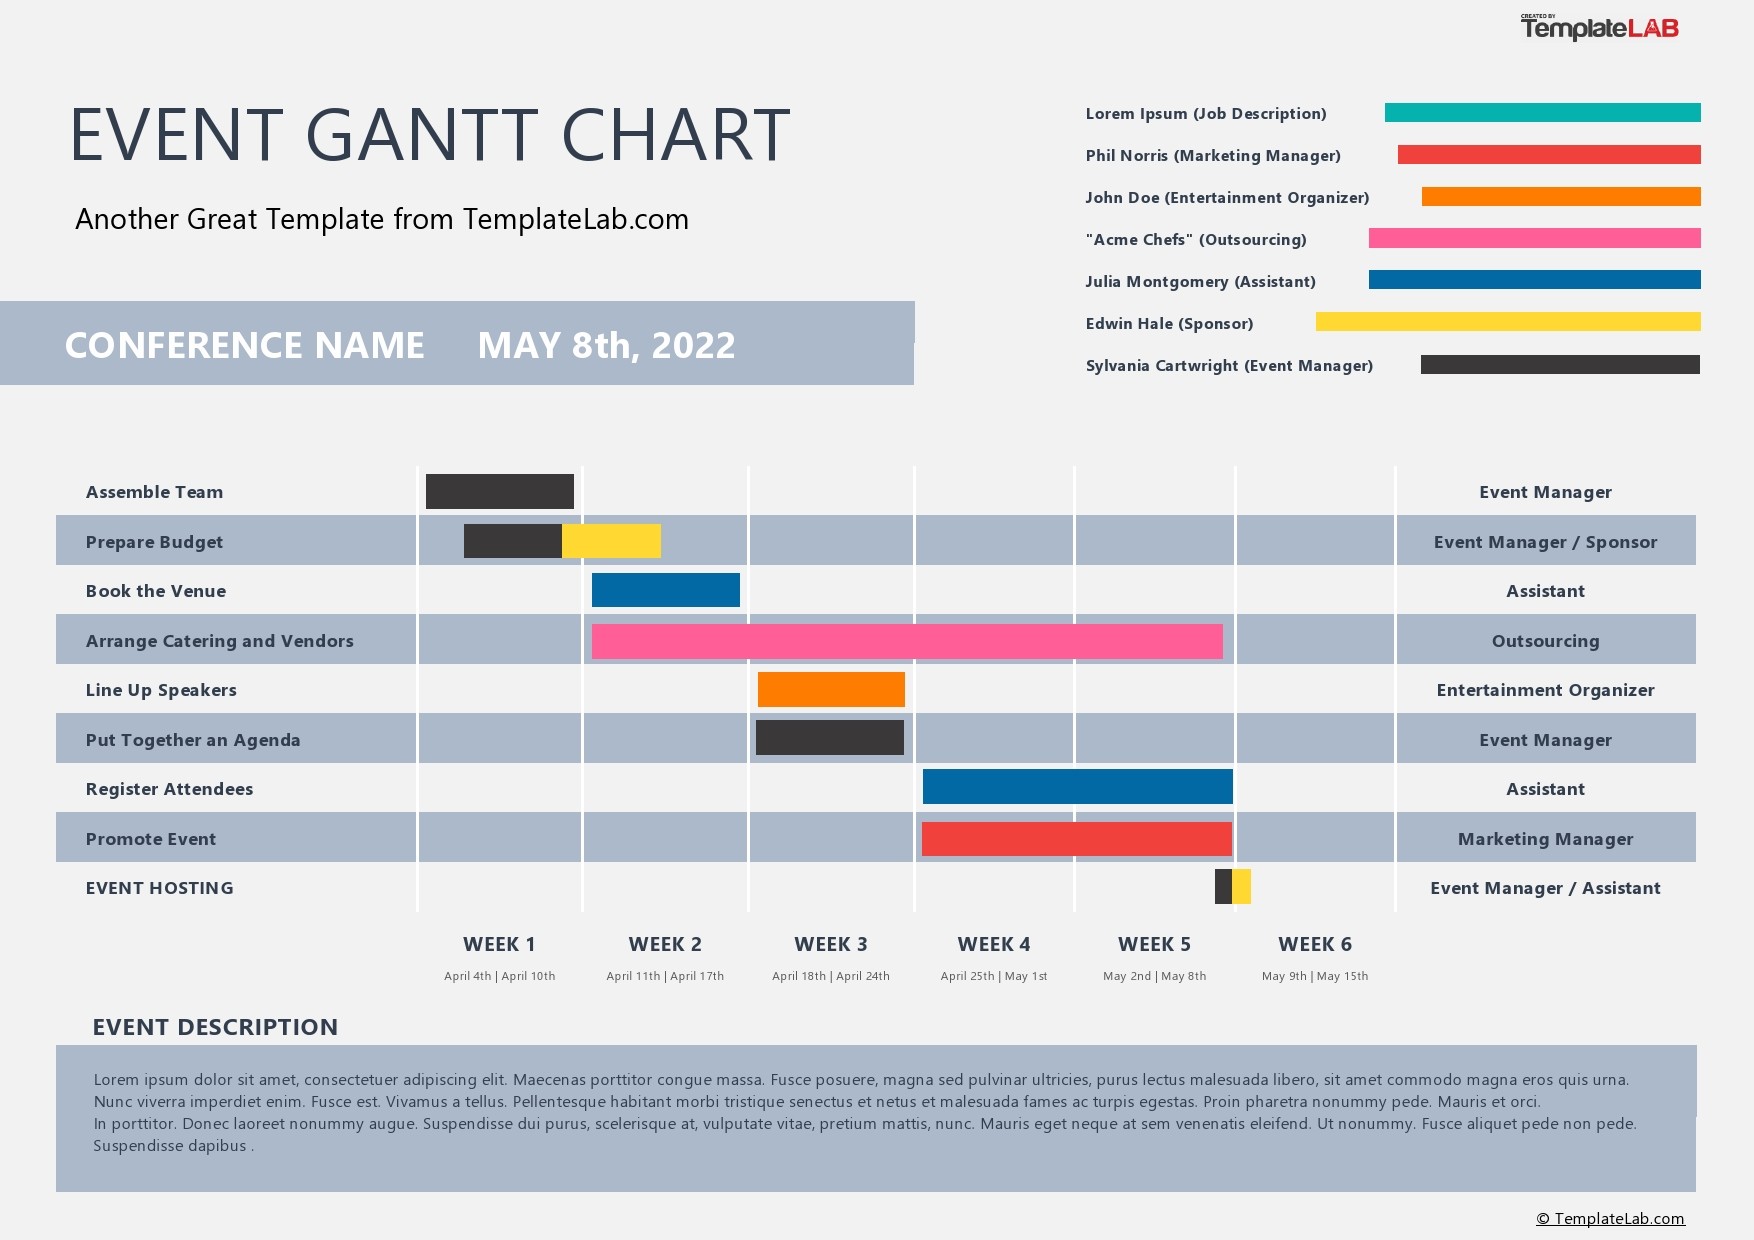
What is a Gantt Chart Used For
A Gantt chart template is useful for visualizing the numerous tasks and projects that are carried out concurrently inside an organization along with their current status.
Management often uses them to plan and schedule these projects to distribute resources efficiently. They are also used to ensure that higher-priority tasks and projects are completed before lower-priority ones.
Any sector or field can use the Gantt chart because it is such a versatile project management tool for determining deadlines and job dependencies.
Here are a few ways in which Gantt charts are used in different scenarios:
- Project management: Gantt chart gathers the data that project managers use to produce a visual timeline that displays all of a project plan’s components in one location. Project managers can schedule projects, allocate resources, establish costs, and include a sales process timeline in their Gantt chart template.
- Construction: To plan the many phases of a construction project, such as initiation, pre-construction, and procurement, general contractors, project owners, and construction project managers utilize Gantt chart templates. However, they can also be applied on a smaller scale to organize routine chores within the construction industry.
- Software development: Gantt chart templates are used by software engineering teams to build project roadmaps. This is crucial for task management when creating new products. This can be done using a Gantt chart template by simply plotting software development tasks on a timeline as if it were a project plan.
Pros and Cons of a Gantt Chart Template
Gantt carts are used in a variety of different areas and ultimately help teams set a project schedule. These projects can be made with the aid of project management tools like Microsoft Project Microsoft PowerPoint, SharePoint, and Excel as well as specialized software applications.
While Gantt charts are used in a variety of different professions, they do still have their pros and cons.
- It can be used to track progress and allocate resources.
- Identifies potential delays within the project’s timeline .
- Provides a clear, visual depiction of the plan that is generally widely understood and reasonably simple to build.
- Serves as a communication tool for employees, making it easier to manage projects.
- They don’t display dependencies on their own.
- The size of a timetable that can be read and understood has a limit.
- These charts are not adaptable to change readily as a result of advancement or a shift in scope.
- Gantt charts are also prone to errors.
How To Create Your Own Gantt Chart Templates
Before setting up your first Gantt chart template, you’ll need to consider every aspect of the project and divide it into smaller, more manageable parts. Once you’ve done that, assign each part to an individual or group of people and allocate the necessary resources.
Determine task relationships and the order in which each job should be completed, indicating the anticipated length of time for the entire project and its various dependent tasks and subtasks.
A Gantt chart template will indicate task dependencies (how one task links to another) as well as the tasks in a specific sequence.
That said, below is a simple breakdown of the first steps you’ll need to take:
- Determine the approximate duration of each task.
- Choose the sequence in which the various tasks should be finished.
- Find places where you lack resources.
- Find tasks on your timeline view that will take too long to complete.
- Find out where the schedule can be improved or where any task’s due date can be changed.
- Make a decision and distribute your resources.
- Consider the dangers and issues you might face and have an alternative plan in case something goes wrong.
What to Include in Your Gantt Chart
Let’s dissect the fundamental components of a Gantt chart template so you can see how they work in a project plan:
- List of tasks: Divided into groups and subgroups, tasks run down a vertical axis on the left side of the Gantt chart to defining project activity.
- Time frame : Displays months, weeks, days, and years in a horizontal bar across the top of the Gantt chart, representing how long the project is expected to take.
- Timeline: On an Excel Gantt chart template, this is the vertical line that displays the date at which you complete tasks and their due dates.
- Bars: On the right side of the Gantt chart in most programs, horizontal markers or bars indicate tasks, display status, duration, and start and end dates.
- Milestones: You can use symbols to identify and mark significant occasions, dates, choices, and outputs.
- Dependencies: Tasks that need to be completed in a specific order are connected by light gray lines or arrows.
- Movement : Shows how far along the task is and may do so by using a percentage or bar shading.
- Resourcing allocated : identifies the individual or group in charge of finishing a task, along with the resources and materials needed to complete the job.
Gantt Chart Examples
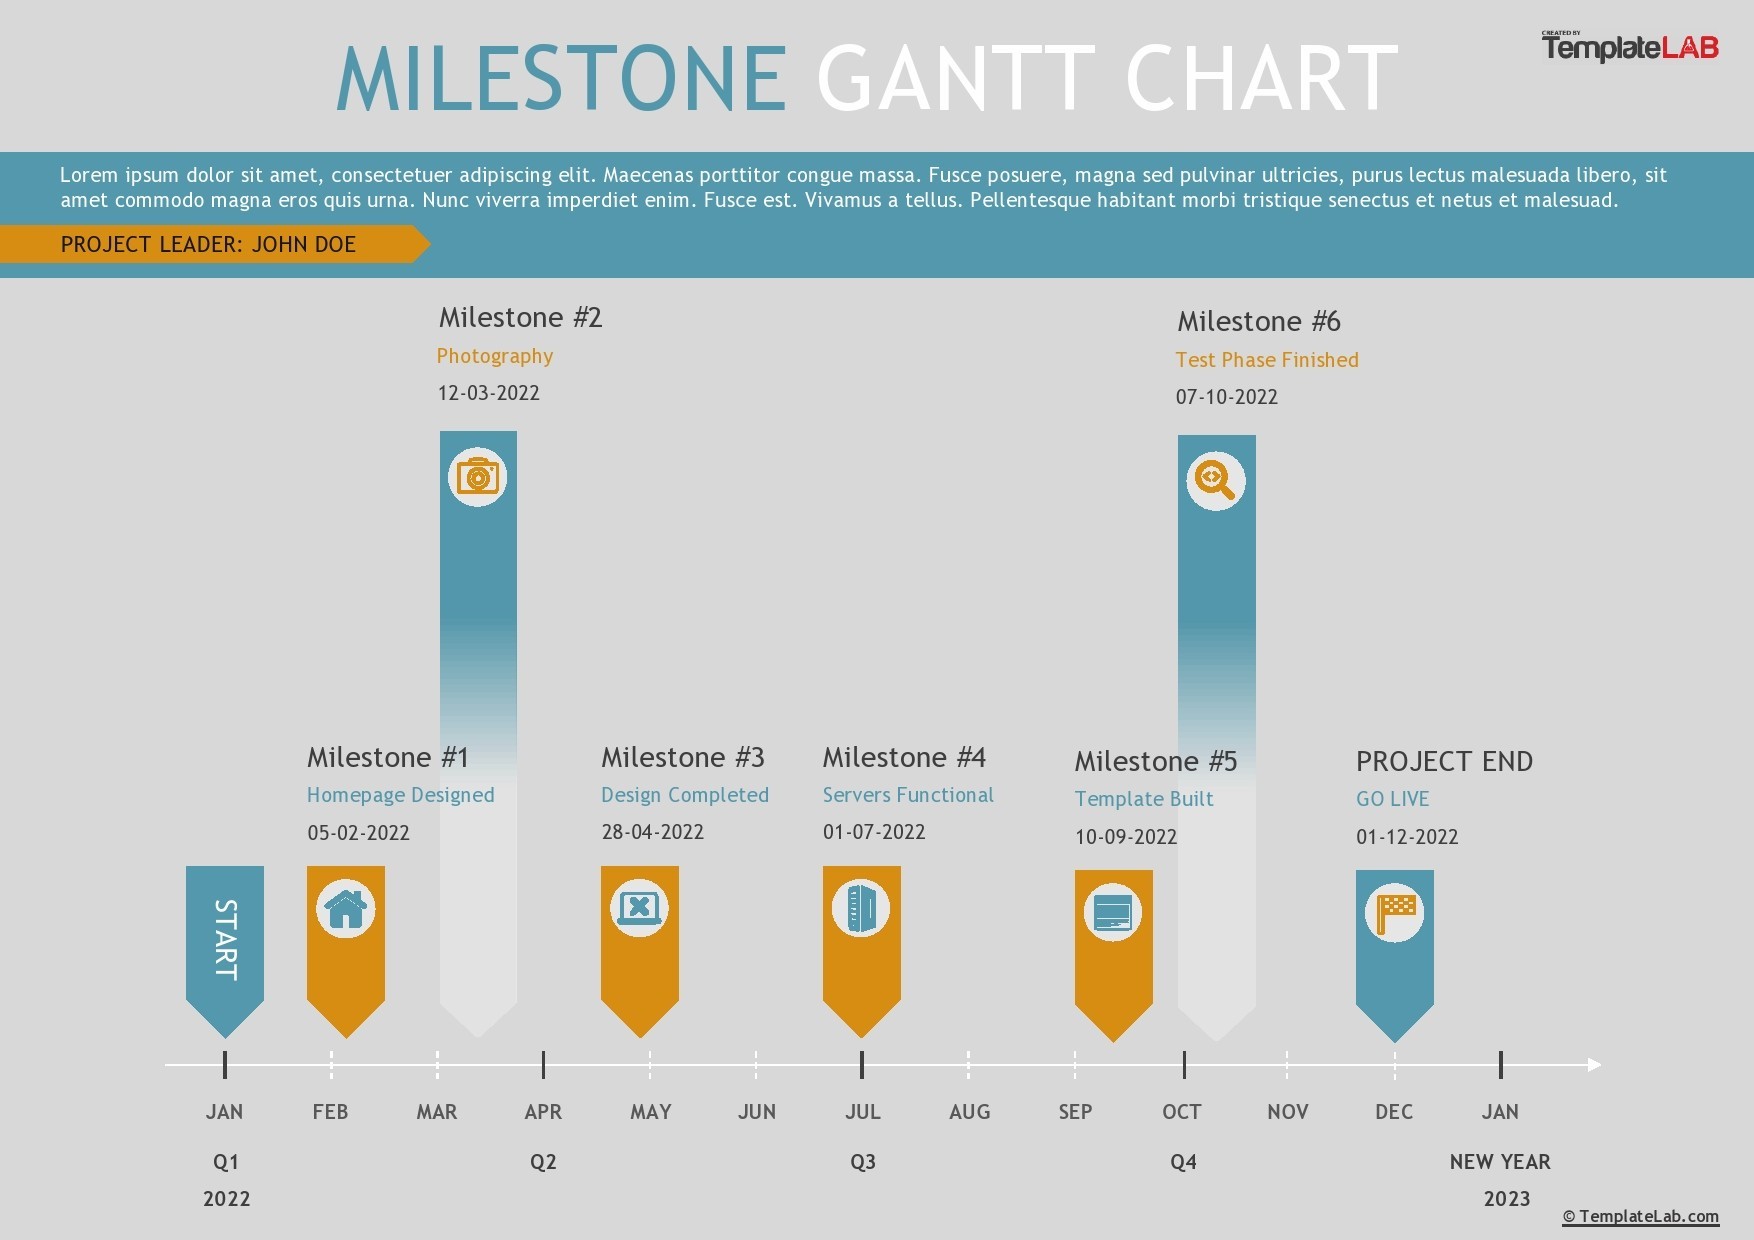
When Should You Use a Gantt Chart Template
When your project demands more preparation than a simple to-do list can provide, a Gantt chart template can help you along the project management process.
Here are a few tell-tale signs that you’ll need a Gantt chart template to manage projects and finish the job to the best of your team’s ability.
- Your task duration is tight and you need to keep track of your team’s progress.
- The project involves several individuals or groups that require precise coordination.
- A supervisor, client, or team member requests a visual breakdown of the project’s progress.
- If your project has even a small amount of complexity. This includes tasks that must be completed in a certain order.
- You must control the workloads of your team members that are busy on many projects at once.
- You know the project timelines and approximately how long each task should or might take.
How To Create an Excel Gantt Chart Template
We all love Microsoft Excel as it can be a useful tool for virtually everything, from tracking large projects to using it as a basic calculator.
Project managers need Gantt charts as one of their primary tools. However, if you are a newbie or only require this type of chart for one project, you can save money by creating a free Gantt chart Excel template rather than paying for pricey Gantt chart template software.
Because Microsoft Excel doesn’t have a built-in Gantt chart tool, creating one in Excel requires a bit of effort. Here is a brief description of how to create a free template.
- Construct a project table To list your project tasks, create a table with four columns. To do this, highlight the rows and columns you want in your table, then go to Home> Table> Format as a table. Add a formula to determine each task’s length by deducting the end date from the start date.
- Construct a stacked bar chart With the information from your project table, create a typically stacked bar chart. First, select the data you want in your bar chart, then click on the Insert tab in the ribbon. Once Excel has created your bar graph, you can give it a project title.
- Modify Data in Your Excel File To edit the axis labels, right-click your stacked bar chart and choose “Edit” from the insert menu that appears under “Select Data”. You can then order your data by categories.
- Format Your Excel Gantt Chart template You must structure this stacked bar chart to display the task bars of a Gantt view if you want to convert it into a Gantt chart template timeline.
To format your Excel Gantt chart template, you can:
- Change the Gantt bars’ color, shape, or pattern by clicking on the paint bucket icon.
- Alter the Gantt bars using a style from the dropdown menu.
- Make a different kind of Gantt bar.
- Insert more text into your Gantt chart template.
- Alter the height and width.
How to Create a Gantt Chart in Google Sheets
Gantt charts in Google Sheets provide you with the projects and the period taken to complete them. It’s usually used as a bar chart that breaks down a project, task, or event and even the time it takes to achieve them.
Creating an online Gantt chart template in Google Sheets is helpful when you make a Gantt chart for a business or team project. To create a Gantt chart template in google sheets:
- Open a new blank spreadsheet in your browser.
- Create a table by clicking Insert>Table and insert a heading.
- Next, you’ll need to enter a value for tasks, a start and end date, and any other relevant key points.
- Once all your data is in place, highlight it and click Insert>Chart template
- Choose the stacked Bar Chart and customize the chart with the menu on the right.
How to Create a Gantt Chart template in Word
Creating a Gantt chart in Word is similar to doing it in google sheets. The first thing you need to do when creating a Gantt chart software in Microsoft Word is open a new document and change the page to landscape.
You can then enter all the necessary data like the project type, tasks needing to be completed, and start and end dates of the project. Once you’ve gathered all your data, enter the data into a stacked bar graph.
You can customize your graph to fit your preferences by right-clicking on the graph and clicking “edit chart”. You can adjust colors, gaps between the horizontal axis and bars, or their display order. It’s important to play around until you find the settings that are right for you.
Creating a simple Gantt chart template doesn’t have to be difficult. With the simple steps above, you can set up your schedule to keep your project phases on track.
To better manage the tasks involved in completing your project, we advise creating your free Gantt chart template to make your life easier.
More Templates
Seating Chart Templates

Birthday Calendars

Excel Dashboard Templates
Staffing Plan Templates
Payment Schedule Templates
Action Plan Templates
- Sample Research
FREE 10+ Gantt Chart Research Proposal Samples in PDF

According to the book “Mastering the Gantt Chart,” the use of the Gantt chart allowed for real progress and advancement in industrial management in the early 20th century. By using a simple and powerful graphical representation, a specific research or work project can be accomplished easily. In this article, we will discuss beneficial steps of creating a proposal for your Gantt chart research , plus we have various downloadable proposal templates for you to use. Keep on reading!
Gantt Chart Research Proposal
Free 10+ gantt chart research proposal samples, 1. gantt chart timeline research proposal template, 2. gantt chart research project proposal, 3. sample paper research management proposal, 4. gantt chart research proposal, 5. gantt chart research proposal form, 6. market research proposal gantt chart, 7. gantt chart research plan proposal, 8. master research proposal gantt chart, 9. gantt chart research project proposal, 10. research project gantt chart template, 11. proposal for thesis gantt chart template, what is a gantt chart research proposal, how to create a gantt chart research proposal , 1. define specific goals, and objectives, 2. collect and evaluate data , 3. explain your methodology and sequence activities, 4. indicate the estimated time, how do you create a gantt chart for a project, how do you write a one page proposal for a research paper, what is an example of a gantt chart, what makes a good gantt chart.
Size: 590 KB

Size: 992 KB

Size: 589 KB

Size: 391 KB

Size: 570 KB

Size: 497 KB

Size: 645 KB

Size: 200 KB

A Gantt chart research proposal is a useful document that comprises main goals, objectives, and methods or strategies established by the researchers in demonstrating the specific timeline and progress, or the essential tasks and time intervals of a particular project.
Being an effective researcher, you need to really learn and apply the significant process and skills, improve your skills, and fully develop a unique end product. In this matter, we suggest that you follow the steps below while freely using one of our templates in this article:
Before anything else, you need to identify the research problem, and define specific goals, and objectives in creating a research proposal for your thesis Gantt chart. Be inspired by the words said by Henry Davod Thoreau: “If you have built castles in the air, your work need not be lost; that is where they should be. Now put the foundations under them.” So, establish a solid foundation of your proposal by creating your goals.
The second step that you should do is collecting and evaluating important data for your proposal. The information you collected will help you to gain valuable information on how you can manage and structure your plan properly. Donato Diorio said: “Without a systematic way to start and keep data clean, bad data will happen.” To maintain order and harmony in your work, use some quality research and analysis methods on your data.
Then, you need to explain thoroughly the different kinds of methods and strategies that you are planning to use for your research study . An Indian actor named Ashish Vidyarthi said: “We make life difficult, and then we try to solve it. My methodology is to simplify things and share them with life examples.” Avoid setting up complicated methods but opt for simple yet effective ones. Also, make a clear list of activities that you need to include for your plan, and sequence them in the proper order.
You need to indicate an estimated time for each item or activity on the list of your research proposal. This will show some clarifications for your readers or evaluators to know if you have allocated enough time to finish your proposed research paper.
To create a Gantt chart, you need to review the scope baseline, and create and sequence activities. Then, estimate your resources and time durations. Later on, you can develop a structured schedule.
Write a catchy title and compelling introduction and a resource review. Describe thoroughly the implementation of your methods. Predict your results. Discuss the possible effect of your results.
An example of a Gantt chart is a bar chart that portrays the beginning and end dates of various elements of a certain project such as resources, milestones, tasks, and dependencies.
A good Gantt chart should have a sufficient time duration or time frames which can be precisely estimated. Include a hierarchical list of goals or work divisions, with tasks and subtasks listed below them.
Therefore, writing a proposal for your Gantt chart research may not be an enjoyable task to you in the first place yet despite the difficulties, you eventually find them to be achievable, inspiring you to perform your best in completing your research work. For planning and scheduling projects, you need to be an expert in using a Gantt chart. So, we recommend that you get a proposal template today to work efficiently on your thesis research project!
Related Posts
Free 10+ content validity samples & templates in pdf, free 10+ construct validity samples & templates in ms word | pdf, free 10+ code of human research ethics samples & templates in ms word | pdf, free 10+ biography research report samples and templates in pdf, free 10+ system documentation samples & templates in ms word | pdf, free 10+ process document samples & templates in ms word | pdf, free 10+ action research samples & templates in pdf, free 10+ longitudinal research samples & templates in pdf | ms word, free 10+ causal research samples & templates in ms word | pdf, free 10+ client discovery samples & templates in ms word | pdf, free 10+ null hypothesis samples & templates in ms word | pdf, free 9+ product knowledge samples & templates in pdf, free 10+ software documentation samples & templates in ms word | pdf, free 10+ exploratory research samples & templates in pdf | ms word, free 10+ experimental research samples & templates in ms word | pdf, free 10+ organizational knowledge samples & templates in ms word | pdf, free 10+ concurrent validity samples & templates in ms word | pdf, free 10+ resource tracking samples & templates in ms word | pdf, free 4+ clinical case study samples & templates in pdf.

Click here to place an order for topic brief service to get instant approval from your professor.
Example of Gantt Chart For Research Proposal
Table of Contents
Gantt Chart For Research Proposal
Are you looking example of a Gantt Chart for a Research Proposal?
Do you know how to set up a gantt chart for the research proposal.
If you don’t know how to set up one then this article is definitely for you because here you will find a sample Gantt chart idea. The easy sample Gantt chart For Research Proposal given below describes the method break down in a very simple and effective way.
By following the steps you will very easily be able to construct your own chat on a research proposal in just a couple of hours. Learn how to personalize your work in the following steps given below. The sample can help you in formatting any types of chart models that you need to insert in your important projects.
Get customized research proposal along with Gantt Chart from our experts at a 25% discount and 100% chance to get approved
Find out about your projections in business strategies related to market fluctuations by following this chart.
By means of this chart, a proper analysis can be drawn out based on projected sales level in the market or these charts can easily be used as a plan out weekly timetable.
These projections just help to show any kind of breakdown that’s needed, it can be in days or weeks, or in a price commodity.
Learning these simple ways of making them, will not just clear the whole concept of the proposal you wish to put forward, but also help in selecting your instrument for approach in your dissertation,
The Gantt Chart has two sides showing, one is for the weaker side projection and the other is for any kind of increase in the value or percentage even shows progress on it.
This Gantt Chart For Research Proposal will always have a central point which is its balance level, and it can predict things on the basis of bar colors. You can easily make them by referring to the samples below.
EASY WAYS TO CONSTRUCT YOUR OWN GANTT CHART FOR ALL-PURPOSE
These websites have collected data from a specimen from many researchers on the basis of the social and commercial needs of the chart. You can refer to them for developing your own easy-to-go chart for multi-purpose.
Follow the guide to get yourself the best and easy tips to build your own Gantts Chart for research purposes.
Sample Gantt chart
That was a practical example for you to make a Gantt chart for a research proposal of your own. Just make sure, you are not using it as it is. Follow clicks by clicking to get your own Gantt Chart For Research Proposal.
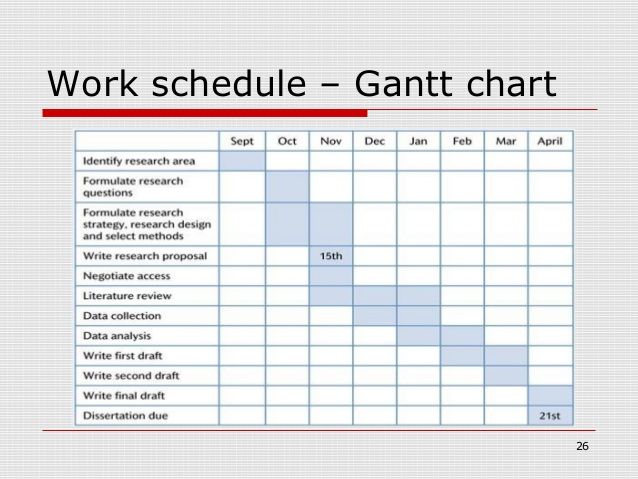
That was a practical example for you to make a Gantt chart for a research proposal of your own. Just follow the easy steps to build the desired chart for your personal research or any other proposal, you are not using it as it is.
Paid Topic Mini Proposal (500 Words)
You will get the topics first and then the mini proposal which includes:
- An explanation why we choose this topic.
- 2-3 research questions.
- Key literature resources identification.
- Suitable methodology including raw sample size and data collection method
- View a Sample of Service
Note: After submitting your order please must check your email [inbox/spam] folders for order confirmation and login details. If the email goes in spam please mark not as spam to avoid any communication gap between us.
Get An Expert Dissertation Writing Help To Achieve Good Grades
By placing an order with us, you can get;
- Writer consultation before payment to ensure your work is in safe hands.
- Free topic if you don't have one
- Draft submissions to check the quality of the work as per supervisor's feedback
- Free revisions
- Complete privacy
- Plagiarism Free work
- Guaranteed 2:1 (With help of your supervisor's feedback)
- 2 Instalments plan
- Special discounts
Other Posts
- 45 Human Rights Dissertation Topics Ideas & Examples February 7, 2020 -->
- 49 Risk Management Dissertation Topics Ideas & examples February 27, 2020 -->
- 49 Waste Management Dissertation Topics Ideas February 27, 2020 -->
- 53 Best Dissertation topics on domestic violence & Examples November 30, 2021 -->
- 53 Sports Dissertation Topics and examples in 2023 March 17, 2020 -->
- 56 Best Critical Care Nursing Research Topics ideas with examples November 18, 2021 -->
- 57 Best Ecommerce Research Topics Ideas and Examples November 30, 2021 -->
- 57 Best Forensic Science Dissertation Topics in 2023 March 17, 2020 -->
- 57 Best Real Estate Dissertation Topics in 2023 March 16, 2020 -->
- 57+ Best Health and Social Care Dissertation Topics in 2023 March 16, 2020 -->
- 59 Anthropology Dissertation Topics Ideas & Examples March 17, 2020 -->
- 62 Ideas for English Dissertation Topics in 2023 March 13, 2020 -->
- 63 Graphic Design Dissertation Topics Ideas February 7, 2020 -->
- 63+ Best Communications dissertation Topics in 2023 March 11, 2020 -->
- 87 Dementia dissertation topics in nursing November 18, 2021 -->
- 99 Microfinance Dissertation Topics Ideas & Examples February 26, 2020 -->
- Animation Topics for Writing a Perfect Animation Dissertation February 4, 2020 -->
- Best 29 Music Dissertation Topics Ideas & Examples February 26, 2020 -->
- Best 35 Cultural Studies Dissertation Topics March 13, 2020 -->
- Best 39 Photography Dissertation Topics and Ideas in 2023 February 26, 2020 -->
- Best 49 Social Policy Dissertation Topics in 2023 March 16, 2020 -->
- Best 49 Sports Psychology Dissertation Topics Ideas February 27, 2020 -->
- Best 53+ Geography Dissertation Topics in 2023 March 17, 2020 -->
- Best 59 Engineering Dissertation Topics Ideas and Examples February 6, 2020 -->
- Best 59 Networking Dissertation Topics Ideas & Examples February 26, 2020 -->
- Best Art dissertation Topics and ideas in 2023 March 11, 2020 -->
- Best Construction Dissertation Topics, Ideas, and Samples March 13, 2020 -->
- Best Environmental Science Dissertation Topics in 2023 March 16, 2020 -->
- Best Film Studies Dissertation Topics in 2023 March 16, 2020 -->
- Best French Dissertation Topics and Ideas 2023 April 1, 2020 -->
WhatsApp and Get 35% off promo code now!
All Formats
Table of Contents
Free 10+ research gantt chart templates in pdf | ms word, 1. research project gantt chart, 2. research centre gannt chart, 3. masters research proposal gantt chart, 4. research proposal gantt chart, 5. research framework gantt chart, 6. managing research project gantt charts, 7. operational research gantt chart, 8. research gantt chart for students, 9. research implementation gannt chart, 10. recruitment research gannt chart, 11. research phase gantt chart, 5 steps to create the research gantt chart, what are the purpose of the research gantt chart, what are the examples of the research gantt chart, how does the research gantt chart works, what are the drawbacks of the research gantt chart.
- Graphic Design
The Research Gantt Chart is utilised to represent the project schedule that involves the duration of the individual tasks, the stages and its depencies and ordering. It keeps up the process of the planning by calculating its duration, the identification of resources, and lays out the order in which the research work need to be completed. It calculates the starting and the end point of the completion of project.

Step 1: Two methods used in creating gantt chart
Step 2: mention research’s start and end line, step 3: gathering all the information, step 4: evaluating activities depending on other, step 5: create graph including timeline and list, more in charts.
Business Research Gantt Chart Template
Research report gantt chart template, medical research gantt chart template, qualitative research proposal gantt chart template, research process gantt chart template, research proposal gantt chart template, nursing research gantt chart template, dissertation research gantt chart template, marketing research gantt chart template, research proposal timeline gantt chart template.
- 15+ Recruitment Process Flowchart Templates in PDF | MS Word
- 8+ Logistics Process Flow Chart Templates in PDF
- 4+ Logistics Flow Chart Templates in PDF | MS Word
- 16+ Simple Flow Chart Templates in Word
- 14+ Medication Chart Template – Sample, Example, Format Download!
- 10+ Business Succession Plan Templates in Google Docs | Word | Pages | PDF
- 50+ Flow Chart Templates
- 9+ Offboarding Workflow Templates in PDF | Word | Pages | Google Docs
- 10+ Onboarding Process Templates in Excel | Word | Numbers | Pages | PDF | Google Docs
- 21+ Printable Shoe Size Chart Templates
- 26+ Blank Guitar Chord Charts
- 10+ Revenue Recognition Templates in Google Docs | Google Sheets | PDF | Numbers | Pages | Word | Excel
- 10+ Business Liability Insurance Templates in Google Docs | Word | Pages | PDF
- 9+ Revenue Model Templates in Google Docs | Google Sheets | Word | Excel | Numbers | Pages | PDF
- Blood Pressure Chart Template – 36+ Free Word, Excel, PDF Format Download!
File Formats
Word templates, google docs templates, excel templates, powerpoint templates, google sheets templates, google slides templates, pdf templates, publisher templates, psd templates, indesign templates, illustrator templates, pages templates, keynote templates, numbers templates, outlook templates.
Instagantt Standalone
Full version of Instagantt. Don't know what Asana is, or don't want to use it with Asana?

Instagantt for Asana
If you need to manage your Asana projects in Instagantt, this is your product.
Top 10 Gantt Chart Examples for Project Management (Updated September 2024)
When it comes to running your own projects or keeping track of things with your team it’s important to know all of your options. And one of the best options that you have at your disposal is a Gantt chart . You just need to take a little bit of time to see what the options really are. You might even be surprised by all the different ways that a Gantt Chart Maker can be used and all the different types of industries that can use them. So, let’s take a closer look.

Why Gantt Charts ?
Gantt charts are a great option for anyone because they allow you to track anything and everything related to your tasks, projects and more. No matter what industry you’re in you can set up a Gantt chart that will help you get your job done more efficiently and more effectively. And that’s going to mean you get a whole lot more money in the bank in the long run. What could be better than that?
Gantt charts will help you to know:
- The duration of the entire project.
- How much your activities cost, and how much your project is likely to cost.
- Know what the different activities are
- When activities need to start, and when they need to finish.
- How long your activities were primarily scheduled to last.
- Current progress status.
- Which activities depend on others to be effectively completed.
Let’s take a look at some of the best Gantt chart examples available, so you can select the best fit for you and your team:
1. human resource planning template.
When it comes to planning things out in human resources you might not realize just how much is involved in the process. The truth is, you’re responsible for nearly constant updates and strategies related to all of the different trends within your company, which means you need to know about who is being brought in, who needs to be brought in, where to reprimand or even fire and a whole lot more. In fact, as the human resources team, you are responsible for practically everything related to the employees within your business. Planning properly means that you’ll be able to plan and be prepared for whatever might happen within the company. It means that if you need to bring in new people or if you need to get rid of some you’ll be prepared for it and know how to do it and what to do. It allows you to have the tools you need to keep your company running smoothly and makes sure that each of the people who are brought into the team can execute the tasks that they need to make the business a success. But how does a Gantt chart fit into that? A Gantt chart is perfect for human resource planning because it gives you plenty of strategic opportunities. You can easily document progress on any projects, processes, and even individuals that you need to within your charts and you can make sure that you are mapping out and even designing your strategies effectively.

2. Construction Gantt
Anyone can tell you that managing a construction project is crucial. Without adequate planning, things can easily go wrong and you could end up with some serious problems. In fact, projects could be completed incorrectly, leading to wasted money, time, and potentially even to injury. That’s why making sure you have everything written down, planned out, and carried out in the proper sequence and more is something you absolutely want to work on. But how do you make sure that you’re doing all of those things? With a Gantt chart, of course. When you plan properly you can make sure that you have all of the right tools and equipment. You can make sure you have all of the right people and you can make sure that you are on the right path to getting the project done properly and quickly, no matter what it is that you’re actually doing. In fact, Gantt charts can be used for small projects or large projects and they’re important for anything you want to put together as well. These charts will allow you to make sure you keep on schedule when it comes to your timeline and that each step of the process is not only being done but being done correctly. You’ll be able to visualize all of the tasks and even organize and prioritize as well as assigning each of the tasks to different members of your team.

3. Sales Process
When you’re in charge of sales you must know what’s selling and what’s not. You need to know who is doing well with their sales and you need to know who isn’t holding up their end. Not to mention you’re going to need to know who you still need to reach out to about a lead or who needs a follow-up call and a whole lot more. If you don’t keep track of all of these things at once you risk missing out on a whole lot of money and sales. That’s definitely not something you’re going to want when it comes to making a living on sales. If you’re a sales rep yourself you can keep track of all of your personal sales, contacts, leads, and more with a Gantt chart. If you’re the one in charge of all of the sales reps it’s even more important to use one of these charts to make sure you know what everyone is doing and if they’re actually holding up the standards that they should be. You might also want to recommend that each of your team has their own Gantt chart to track their information while you’re using it to keep track of all of them as a whole. With one of these charts, you can slim down the sales process and start feeling a whole lot better about how well you’re keeping on things. There’s no longer any reason to worry about something slipping through the cracks because the Gantt chart holds everything you need to know.

4. Product Roadmap Template
All right, so you’re ready to create a new product but you have a whole lot of steps to get through before it’s going to be ready, right? Well, that’s not going to be a problem if you know how to track it all. You need an organizational structure that lets you map out each of the different things that go into creating your product. You also need to make sure that you’re following all of the right formattings, meeting all of the deadlines, and a whole lot more. When you have a way to organize all of this information you’re going to be off to a better start. You’ll have no problem creating an effective roadmap if you know where to start and a Gantt chart is going to be a great way to do exactly that. This type of chart will let you layout each of the major tasks that need to be completed between where you are now and where you want to be (launching your product). You can set each of them up as separate tasks and then create subtasks within each of them. Those subtasks can even be assigned to different people on your team or given different deadlines and more to make sure that they get done. With a Gantt chart and proper organization, you’re going to make sure that you have everything you need to get your product off the ground. Create a high-class strategy and actually put it into action and you’re going to be off to a great start. Plus, you’re definitely not going to skip out on making a Gantt chart next time when you see how simple it is and how much easier it makes things.

5. Digital Marketing Plan Template
Digital marketing is a crucial aspect of any business because it pertains to the advertising that your customers and potential customers will see about you. In most cases, this pertains to advertising through social media, but it can pertain to other forms of digital conduct as well. Plus, done properly, it’s going to make sure that you can reach out to the right people. You want your target audience to be able to find you, and digital marketing is one of the only ways you’re going to do that. A Gantt chart allows you to create a plan for all of your digital marketing. Instead of just creating advertising as you go along or just ‘winging it’ you’re going to have the ability to actually lay out a cohesive strategy that will get you from point A to point B in no time. You just have to lay out the different pieces of the puzzles, including the different tasks that need to be accomplished and who is going to work on them. All of this is going to make it easier for you to execute the plan. With your Gantt chart, you won’t have a problem building a marketing plan schedule that’s extensive and in-depth because you can create all of the tasks and sub-tasks and more that you need. You’ll be able to oversee everything that goes into your project as well, including budgeting, deadlines, and even who the different tasks are assigned to.

6. Employee Onboarding Template
When you bring a new employee into your team you want to make sure that they can actually fit in with the team and with all of the different aspects of the job. But how do you make sure of that? You need a consistent onboarding process that will help you along the way. With an onboarding process, you’re going to have a better chance of getting your new employees up to the standard that you want in a short amount of time. You won’t have to worry about someone falling behind or not knowing how to carry out something because they’ll be fully trained. When it comes to training new people it can be difficult to keep track of what they need to know and what they’ve already gone through. With a Gantt chart, you can create sections and tasks for each new employee and make sure that you’re going through each of those tasks with them. That’s going to make the process of onboarding more efficient and more effective . Not to mention it’s going to make your new employees and your existing employees feel a whole lot better about the arrangement. A Gantt chart makes sure that you can create the exact onboarding process that you want. You can set up as many or as few steps as you like and you can customize the entire chart to fit your preferences for visualization and more.

7. Video Production Template
Producing a video is a lot like producing a product in that there are a whole lot of different steps involved and you have to make sure that you don’t miss any of them. If you do you could find yourself struggling to get that video out at all let alone getting people to pay for it. But when you get organized you’ll have the opportunity to stay in charge of your project and to stay on track at all times as well. That means managing the writing, shooting, editing, and more. And it’s all important no matter the length of your video. With a video production Gantt chart, you’re going to have a method of creating structure and flow to your process. You’ll be able to keep yourself moving in the right direction at every turn and you’ll be able to manage input, suggestions, requirements, and content from different people and even different departments as needed. You’ll even be able to keep careful watch over what everyone is doing and whether tasks are being done properly and on schedule. Using a Gantt chart makes sure that all of the steps that have to be carried out don’t get too overwhelming. After all, with everything you’re responsible for making that project go off without a hitch you might be a bit nervous about something being missed or not done to the standard you expect. With a chart to organize, you don’t have to worry about any of that.

8. Mobile App Development Project Plan Template
Building a mobile app is an important step for just about any business. After all, in today’s world, it’s more common to find an app available for a brand or company that you want to associate with than it is to not find one. You don’t want to be the only company that doesn’t have an app when you’re trying to get attention and business from customers. And that’s only for businesses that exist outside of an app. If you’re looking to create an application as your business it’s even more crucial to get things right. With a Gantt chart, you’re going to have the ability to layout the steps that it takes to create your app. And that means everything from designing what the app is going to do to actually going through the process of creation. It means working with a host of different people, departments, and more to get that app done from scratch. And when you use a Gantt chart to help you you’ll be improving your chances of getting it done properly and more quickly. That’s kind of the whole point, right? You want to make sure everything is done in a way that gets you to a successful launch? Well, a Gantt chart makes sure that you can set up your timeline properly and then follow through with every step along the way. You can make sure that each task is assigned to someone and that they are being completed by the deadline. And you can make sure that you always have the equipment, people, and tools that you’re going to need.

9. Social Media Planner Template
If you’re going to be involved with social media in any way you need to keep track of your posts, your content, and a whole lot more. You need to know how to track where you’re posting, what you’re posting, and when you’re posting. Not only that but you’re going to need a way to make posting even easier so that you can really build up engagement. You may even want to make sure you can keep track of what’s doing well and what isn’t doing so well in the process. By creating a social media planner you’re going to improve your chances of actually posting all of the times that you want to. You’re less likely to miss a post because everything is scheduled out for you and makes it easy to remember. You can even layout information with more than just your own charts involved. If you want to keep track of someone else’s social media you can do that too. Or you can have multiple people work with you in creating your own. All you have to do is create a Gantt chart and you’re going to have no problem pushing through. These charts allow you to set up details of what you want to post so you know when to do it, where to post it, who’s in charge of the post, and anything else that you want. You can also adjust and rearrange your posts and content however you want and whenever you want. All of that is going to make it easier for you to stay on top of your goals and plans for your social media pages, whether for personal or professional use.

10. Gantt Chart Template for Email Marketing Specialists
Are you an email marketing specialist? If you are then you absolutely need to keep track of timing for your email marketing campaigns. You need to keep track of content that’s doing well and content that isn’t and you absolutely need to make sure that you’re always aware of what’s happening within your business. That means keeping track of a whole bunch of dates, times, contacts, subjects, and more. But just strategizing things on your own can be a whole lot more difficult than you might have thought. The key is using a Gantt chart to make sure you stay on top of everything. As an email marketer, if you don’t keep track of everything related to your emails and your contacts you could miss out on a whole lot of sales. Not to mention you could find yourself losing contacts and leads. Instead, you want to make sure that you have a chart to track your tasks, including follow-ups, strategies, resources, actions, and a lot more. All of these things are going to make it easier for you to get on task and to stay that way. With a Gantt chart, you’re going to be ahead of the game when it comes to laying out your strategy and then executing that strategy to the fullest. You’ll be able to make sure that every person that comes into contact with you or your business in any way is going to get the full experience of your company.

Conclusion time
If you’re looking to start using Gantt charts for yourself and your business make sure you’re getting creative about it. There are plenty of options when it comes to these charts and the ones we’ve talked about here are just a small peek into those options. All you have to do is take a look and see how you can customize things to fit your needs. Luckily, when it comes to creativity, flexibility, and user-friendliness, you’re definitely not going to go wrong with Gantt charts for your company, no matter what industry you’re actually in. Instagantt will provide you with all of the features and options that you need in order to make Gantt charts work for you. Whether you’ve ever used them before or not, you will be able to create one in no time because this system makes it as simple as possible. The user-friendly, intuitive design and customizable features will ensure you have nothing to worry about when it comes to creating the type of chart you and your business need.
We offer monthly and yearly subscriptions. Sign up for free, no credit card required.

Based on 10.000+ reviews on

Make a Gantt Chart Online Now
Start managing your projects efficiently & never struggle with complex tools again.
Ready to simplify your project management?
Get organized with Gantt chart templates
Gantt charts give you a visual timeline of the steps in your project, and they've never been easier to put together than with these templates. with just a glance, you'll know exactly when and how things will come together, and these templates will be just the beginning of your journey to a successful, well-run project..
Let these Gantt chart templates guide your success
Let these customizable Gantt chart templates help your business see into the future. This staple of project planning just got easier to outline with templates where all you need to do is bring your parameters and yourself to get started. A Gantt chart is the ideal tool to coordinate groups of people and simultaneous goals and keep all aspects of a plan moving when they're supposed to. With these easy-to-use templates, your Gantt chart can be as colorful and as detailed as your organized heart desires. Make sure everything's going smoothly for your grand opening by know exactly what you have to do and when you have to do it. Or, add a compelling visual to a presentation by laying out the various elements of your project in a comprehensive yet comprehendible way. Dive into timelines and deliverables and let the planning stage of your project be the easy part—a Gantt chart is your business's new best friend.
Planning your PhD research: A 3-year PhD timeline example

Planning out a PhD trajectory can be overwhelming. Example PhD timelines can make the task easier and inspire. The following PhD timeline example describes the process and milestones of completing a PhD within 3 years.
Elements to include in a 3-year PhD timeline
What to include in a 3-year PhD timeline depends on the unique characteristics of a PhD project, specific university requirements, agreements with the supervisor/s and the PhD student’s career ambitions.
For instance, some PhD students write a monograph while others complete a PhD based on several journal publications. Both monographs and cumulative dissertations have advantages and disadvantages , and not all universities allow both formats. The thesis type influences the PhD timeline.
The most common elements included in a 3-year PhD timeline are the following:
The example scenario: Completing a PhD in 3 years
Many (starting) PhD students look for examples of how to plan a PhD in 3 years. Therefore, let’s look at an example scenario of a fictional PhD student. Let’s call her Maria.
In order to complete her PhD programme, Maria also needs to complete coursework and earn 15 credits, or ECTS in her case.
You may also like: Creating awesome Gantt charts for your PhD timeline
Example: planning year 1 of a 3-year PhD
Most PhD students start their first year with a rough idea, but not a well-worked out plan and timeline. Therefore, they usually begin with working on a more elaborate research proposal in the first months of their PhD. This is also the case for our example PhD student Maria.
Example: Planning year 2 of a 3-year PhD
Example: planning year 3 of a 3-year phd, example of a 3 year phd gantt chart timeline.
Combining the 3-year planning for our example PhD student Maria, it results in the following PhD timeline:
Final reflection
In fact, in real life, many PhD students spend four years full-time to complete a PhD based on four papers, instead of three. Some extend their studies even longer.
Master Academia
Get new content delivered directly to your inbox, 10 amazing benefits of getting a phd later in life, how to prepare your viva opening speech, related articles, 25 short graduation quotes: inspiration in four words or less, 3 sample recommendation letters for brilliant students, writing a successful academic cv (and a free template), are doctoral summer schools for phd students worth it.
- How It Works

Our templates enable you to start planning straight away and help you get things done
Research project plan.
Writing and planning a research project such as a dissertation paper, especially for a first-timer can be a real pain in the neck to get started with. So many things to consider, read and write that you just can't see the end of it all. Our advice? Keep calm (as they would say on 9gag) and think of the whole thing as a series of tasks, like in any other project. And this is where we come in. With Tom's Planner you can schedule your dissertation project with just a few clicks, giving you a clear overview of what needs to be done (and when) in smaller, more manageable steps. Not so scary anymore, is it?
Be sure to check out our blog as well, where you'll find lots more useful tips and tricks about writing and scheduling dissertations.
Help With Dissertation Planning
So we have established that that creating a timeline for your research project is essential. Some people make their Gantt chart in Excel, but using Tom's Planner is a lot more flexible and intuitive. Our research project plan example has all the main stages and sub-stages pre-set and grouped in advance for you, all you need to do is insert the actual tasks and set them to the right time and duration. So even if you are doing this for the first time, you will instantly see that it's probably a good idea to get your dissertation proposal approved before reading 14 books on the subject. Good to know, that.
Effortless planning with our research project plan example
Planning a research project such as a dissertation is really simple if you think about it. Unlike in project management, most of the tasks come one after the other, not in the same time, making it a lot easier to see through. On the other hand, most of the tasks need to be performed by none other than yourself, so there's really no one else to control. You can make things even easier by moving the tasks about when needed or adding comments and icons to them. Feel like rewarding yourself after a completed chapter? Add a little cake icon at the end of the box for extra incentive. Yum!
Sharing made easy
Making a good impression on your tutor (so he will accept the proposal you botched together last night) and keeping him happy throughout the process is vital for your success. That's why we made sure that Tom's Planner great for sharing, online or offline. Show him the research project timeline you created in Tom's Planner (watch him get blown away), keep him informed in real time on your progress, wherever you are, or export the schedule to the desired format in case of personal consults. Schedule your dissertation project the easy way: with Tom's Planner. Be sure to check out our blog as well, where you'll find lots more useful tips and tricks about writing and scheduling dissertations.
Examples & Templates:
Join 117,658 customers and have your first gantt chart live today.
Or, sign up with: Google
- Project Management Tutorial
- Characteristics of Project
- Project life cycle
- Project Management Lifecycle Phases
- Quality management Techniques
- Risk management
- Agile vs. Waterfall
- Project Management Tools
- Scrum methodology
- Agile Project Management
- Product Management Tutorial
- Software Engineering Tutorial
- Software Development Tutorial
- Software Testing Tutorial
Gantt Chart Example for Project Proposal
Gantt charts provide a visual roadmap showing project activities, timeframes, and dependencies, and are the core tool in project management . These charts, which have their roots in the important work of Henry L. Gantt, give team members and project managers a clear picture of project timetables and progress. Gantt charts reduce the complexity of project planning, coordination, and assessment throughout the project lifecycle by depicting tasks as horizontal bars.
Table of Content
How to Create a Gantt Chart?
Gantt chart tools.
1. Define Project Tasks: First of all, there is a definition of the task. It consists that all activities required for project implementation are identified as a result. They develop a list where various aspects of the projects have been broken down into smaller bits thus making them more manageable.
2. Estimate Task Durations: In estimating time, it would be important to evaluate how long each task would take. This can support resource allocation and ensure that the project plan matches with specific needs under consideration complexity among other dependencies and capabilities should be borne in mind.
3. Create a Timeline: The timing units for your Gantt chart may be days, weeks, or months. Consequently, create a project timeline that spans the entire duration of the project to visually show when different parts of the project are expected to achieve certain milestones and other significant points. This will therefore guide team members on deadline dates while at the same time monitoring their progress in their respective projects.
4. Set Start and End Dates: The commencement and termination of the work depend on the schedule of the work and tasks that have to be done. In addition, they should come up with practical timelines that consider some external circumstances that can prevent a project from going as planned. These procedures help in creating a good plan.
5. Draw Task Bars: A Gantt chart can be directly put on any such task. Each point on a graph is shown as a vertical line. This helps to visualize project timelines and important tasks in minutes, making it easier for team members and stakeholders to arrive at decisions for consensus.
6. Include Milestone: The milestone summary in your Gantt chart shows the key dates of accomplishment or completion and counts them. Milestones are crucial signposts upon which one can check whether they are doing anything worthwhile towards realizing their target. Otherwise, how would you know when you are moving either too fast or just right? Teams want well-defined objectives so that they know where they are headed and what has been achieved.
7. Regularly Update and Monitor: Always make sure that the Gantt chart is continuously updated for progress demonstrations. The pictures must show if the project was completed or delayed. This helps in enhancing project control and fast decision-making processes in a timely way. The team stays informed and adaptive through regular updates.
1. Gantt chart for Enterprise Resource Planning
It is an enterprise resource planning (ERP) software solution that automates business processes across divisions, provides critical information, and improves the performance of an organization.
.png)
Gantt chart for ERP
Let us break down each part with the timeline as follows:
- Requirements Analysis (Jan-Feb): This stage encompasses developers involving stakeholders who gather functional and non-functional requirements of the ERP system to support further discussions with key users, such as top management, who could identify goals, allocate resources, etc.
- System Design (Feb-Mar): At first, the entire system design procedure begins by creating blueprints for enterprise resource planning (ERP) based on requirement analysis results that may include general designs and data flow maps and distinguishing different items from one another.
- Database Schema Modification (Mar-May): Change the database schema to fit in with the system design. It includes language definition, relationships, and data storage requirements for an ERP system that meets user requirements.
- User Interface (UI) Design (Apr-Jun): That is what the UI design phase in an ERP system is for. To guarantee that all graphical elements of this system are self-explanatory and meet users’ expectations, designers will be working on wireframing and prototyping.
- Module Development – Finance (May-Aug): This is exactly what UI designers have been doing in an ERP system. The purpose of this phase is to ensure that every graphical element of this system has instant meaning and meets users’ expectations; designers will be working on wireframing and prototyping.
- Module Development – HR (Aug ) : Additionally, the development of the Human Resources module which encompasses personnel management procedures, payroll as well as HR will begin here. See to it that you smoothly blend HR capability with other modes.
- Inventory Management (Aug to Sept): This system is designed for the management of purchases, keeping track of inventories, and placing orders. Understanding its integration with other modules will help in ensuring that it’s running as a single unit.
- Integration Testing (Sept to Oct): This is a time when the integration testing period is met, where there are tests done on the entire ERP system to fix any discrepancies or problems that may arise in the jointing up of different structures. At this level, good communication and information must be maintained between modules.
- User Acceptance Testing (UAT) (Oct to Nov): The UAT phase involves users ensuring that they test if the ERP system is working in line with their requirements. This helps you get feedback from stakeholders. “If the user finds any problem with the software, he writes back his grievances for rectification.”
- Deployment and Training (Dec): Here comes deploying ERP on manufacturing premises, followed by teaching workers how to use it. This marks the last point at which a body shifts from development to using it.
For an efficient and effective ERP project, three quarters are enough for twelve months. Each quarter represents a dedicated phase from early planning, research, and analysis to implementation, testing, and final delivery to make sure that this is concluded effectively within the limited timeframe.
2. Gantt chart for Customer Relationship Management
CRM is an efficient way of managing relationships with current and potential customers that businesses have. Besides, it enhances customer satisfaction, loyalty, and profitability in a business.

Gantt chart for CRM
Let us then break down each part with the timeline as follows:
- Requirement Analysis (January – Week 1 to Week 2): The first two weeks of January were filled with several activities such as reviewing and determining what the stakeholders would like to see about CRM software development.
- System Architecture Design (January – Week 3 to Week 4): For the next two weeks of January, the development team was allowed to design the system architecture which demonstrates the structure and basic elements of CRM software.
- Database Design (February – Week 1 to Week 4 ) : In January there are database schema design changes therefore February is when data should be properly saved.
- User Interface Development (February – Week 4 to March – Week 2 ) : The user interface was dynamically developed last week in February and continued into the first two weeks of February and March, in terms of user-friendly design.
- Functionality Coding (March – Week 2 to March – Week 3 ) : During the second and third weeks of March, functional coding for a CRM is carried out to turn the structure into works of art.
- Beta Testing (March – Week 3 to April – Week 2): From the third week of March up to April 2nd, beta testing will be done to detect and fix any problems that may exist before the final release.
- Deployment and Training (April – Week 3 to Week 4): The software will be distributed third or fourth week of April as an example while training is going on concurrently to raise users’ awareness about new system functionalities.
This cycle includes four months: initial requirements which include design processing leading to data integration, user interface design and development, coding and testing, beta testing, distribution, and training. This business model optimizes the development process making it efficient and effective.
3. Gantt chart for Autonomous Vehicle Navigation System
The systems that enable these vehicles to move around and make decisions without human input, while ensuring safety and security built on algorithms, sensors, and real-time data are referred to as autonomous vehicle navigation systems.

Gantt chart for Vehicle Navigation
Now let’s break down each component with a timeline as follows:
- System Requirement Analysis (Mid Week 1 to Mid Week 3): In this period of three weeks, the team will familiarize themselves with the problem. A system must have the ability to specify requirements that define characteristics or specifications for an autonomous control system.
- Algorithm Design and Implementation (Mid Week 2 to Mid Week 5 ) : As such from weeks two through five, we have algorithm design and implementation. This involves coming up with ideas for coding algorithms that can help in self-driving cars.
- Sensor Integration and Calibration (Week 4 to Week 5 ) : By the fourth up to the fifth week, LiDAR as well as cameras and radars among others get embedded in them. These calibration processes should enhance accurate reliable sensor data.
- Testing and Validation (Week 5 to Mid-Week 8): Starting from the fifth week to the eighth week, testing and validation will be performed. This stage involves comprehensive system-wide testing of algorithms, sensors, and integrations necessary for functionality, reliability as well as precision.
- Finalization and Deployment (Mid Week 8 to Mid Week 12): From week eight mid-week up to week twelve mid-week, Phase three started when the autonomous navigation system was completed by the team of staff members. All problems experienced are fixed, and in preparation for usage, it is handed over.
The whole process took twelve weeks to come up with an autonomous driving system for cars. Every week there are specific tasks that include requirements analysis, algorithm design, sensor integration, testing then implementation of the system. This period provides a better way of improving though.
- Microsoft Project: It is a tool of project management that the client can create, control, and review Gantt charts. It also has ‘scheduling’, ‘resourcing’, and ‘working together’ as features.
- Smartsheet: It is the best web-based program for managing projects that include Gantt charting. It allows team collaboration in real-time on any project regardless of where you are located or any other form of project administration that you may wish to use.
- Trello: Trello is some software amongst the very best that manages projects using Kanban boards, cards, and checklists. They do not have built-in Gantt charts in these extensions though there are numerous integrations available for those who want to use them.
- Wrike: This is a collaborative project management software integrated with Gantt Chart which helps in planning, monitoring, and sharing between partners.
- Asana: All such apps have one aim: to plan, organize, and keep track of tasks by teams carrying out different jobs within a company at once; however Asana uses Gantt charts as well as schedule visuals.
- TeamGantt: TeamGantt is web-based software created for the creation and usage of Gantt charts to aid in the process of planning and teamwork. More is offered by them.
Advantages of Gantt charts
- Visual Representation: The display of the way of work schedules is very understandable and plain. This makes it easier for partners to understand work parts and schedules.
- Task Dependencies: They help to know what people have to do by assisting in task analysis and visualization.
- Project Visibility: Gantt charts are a type of visualization tool that enhances project visibility, whereby project managers and other stakeholders can easily identify constraints that limit the ability to move forward and plan accordingly.
- Instant Adaptation: The Gantt chart is one of the tools used in agile project management adapted for either the project, schedule, or capacity.
- Critical Path Analysis: The use of the Gantt chart supports critical path analysis which assists PMs to focus on activities that impact on time performance as well as achieving task completion within the general plan.
Gantt chart is a strong though manageable tool; its construction entails task definition, dependency setting, and programming among others. It helps us through thick and thin when we employ it for example in this Gantt chart. These types of Gantts have a significant role to play such as consent and communication in managing projects. Lastly, they also offer an obvious and accommodative strategy plus an operations approach.
Please Login to comment...
Similar reads.
- Project Management
- How to Delete Discord Servers: Step by Step Guide
- Google increases YouTube Premium price in India: Check our the latest plans
- California Lawmakers Pass Bill to Limit AI Replicas
- Best 10 IPTV Service Providers in Germany
- 15 Most Important Aptitude Topics For Placements [2024]
Improve your Coding Skills with Practice
What kind of Experience do you want to share?
Gantt Charts in Excel: Free Templates + Tutorial
Published: August 26, 2024 - 7 min read
It can be challenging to stay on top of complex projects, but with the right tools, you can keep your projects on track. Gantt charts are a common solution.
This guide explains how to create and use Gantt charts in Excel. You’ll find step-by-step instructions and free Gantt chart templates to download. By the end, you’ll be able to build and customize Gantt charts for your own projects.
Free Gantt Chart and Project-Tracking Templates
Instead of spending hours setting up Gantt charts from scratch, we’ve done the heavy lifting for you.
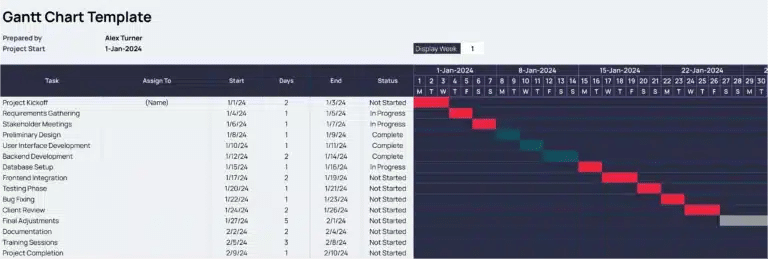
Coefficient’s Gantt Chart Template has all the formulas and formatting ready to go. Grab it here!
Not what you’re looking for? Check out one of our other time-tracking templates below!
Event timeline template ( link )
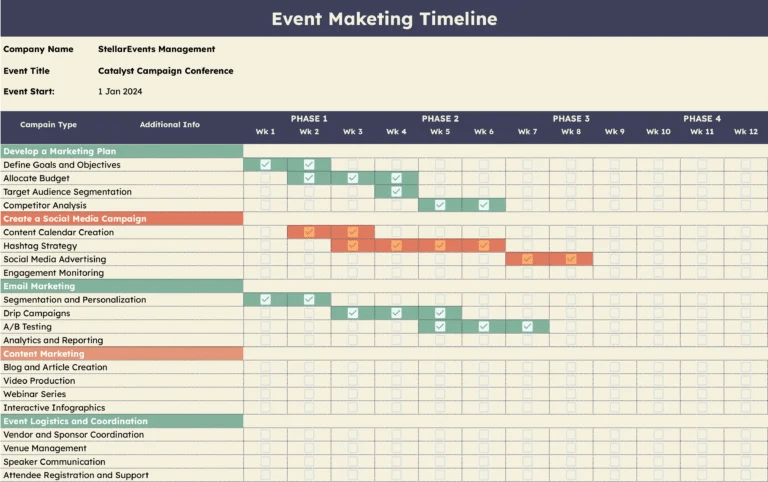
Strategic planning timeline template ( link )

Project timeline template ( link )
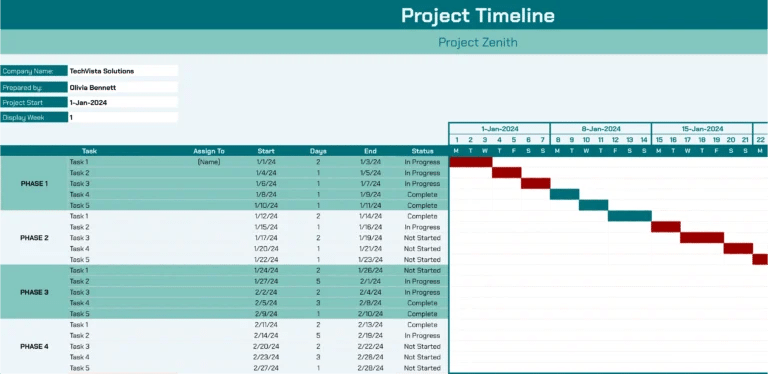
Project Schedule with Timeline Template ( link )
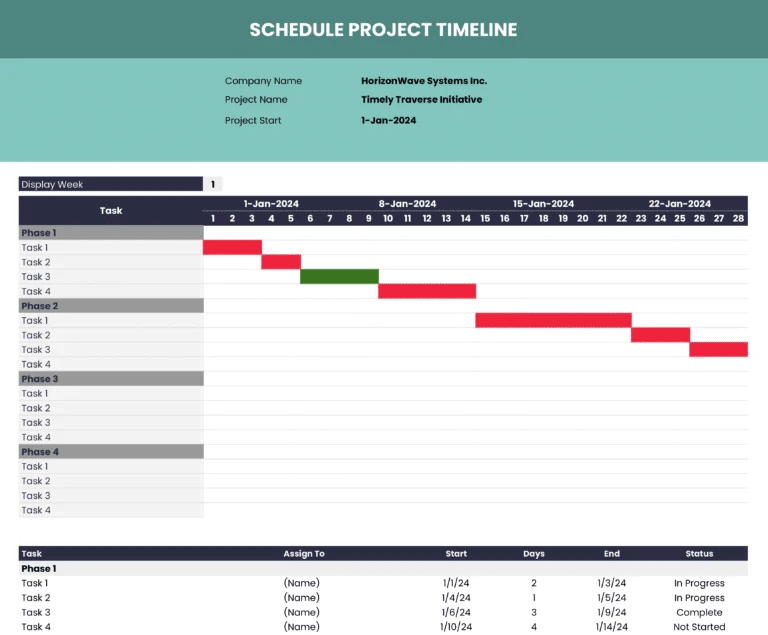
Rather do things the old-fashioned way? Continue on to learn how to create a Gantt Chart from scratch!
How to Create a Gantt Charts in Excel: A Step-by-Step Guide
Excel is a popular choice for creating Gantt charts due to its widespread availability and familiarity. Follow these steps to build a Gantt chart in Excel:
Step 1: Define Your Project Tasks
Begin by identifying and listing all the tasks or activities that need to be completed for your project. This foundational step will create the backbone of your Gantt chart and should include:
- Task Names: Descriptive titles for each task.
- Task Descriptions: Brief details on what each task involves.
- Milestones: Key achievements or checkpoints within your project.
- Task Name: “Market Research”
- Task Description: “Conduct research to understand market needs and trends.”
- Milestone: “Complete research report.”
Step 2: Assign Start and End Dates
For each task, determine the start and end dates. These dates should reflect when each task is scheduled to begin and finish, considering any dependencies or constraints. This involves:
- Identifying Dependencies: Determine which tasks must be completed before others can begin.
- Setting Deadlines: Establish firm deadlines for each task based on project timelines.
- Task: “Market Research”
- Start Date: “June 1, 2024”
- End Date: “June 10, 2024”
Step 3: Create the Gantt Chart
In Excel, you can create a Gantt chart using various methods:
a. Using Excel’s Built-in Gantt Chart Template
- Open Excel: Go to File > New fom Template and search for “ Gantt Chart .”
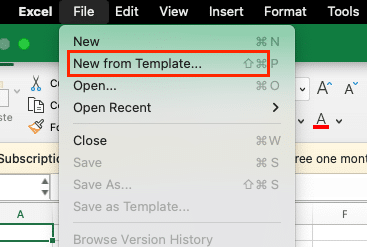
- Select Template: Choose a Gantt chart template that suits your project.

- Input Data: Replace placeholder data with your project’s tasks, start dates, and end dates.
b. Creating a Custom Gantt Chart
- Prepare Your Data: Organize your data into columns for Task Names, Start Dates, End Dates, and Duration.

- Insert Bar Chart: Highlight the data range, go to the Insert tab, select Bar Chart, and choose the stacked bar chart type.
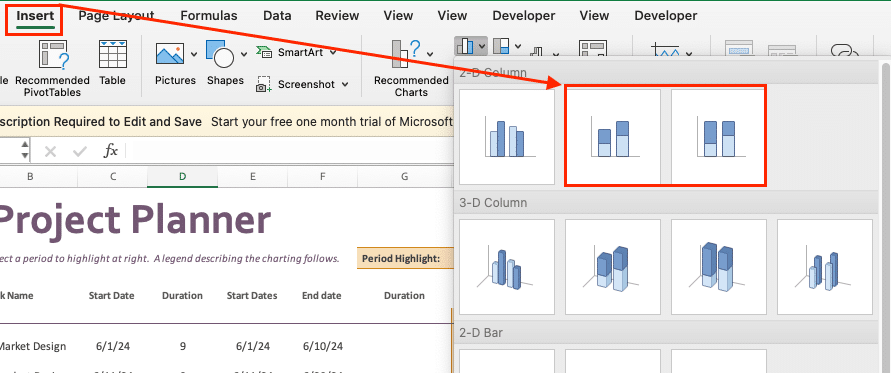
- Adjust Bars: Format the bar chart to display tasks on the vertical axis and timeline on the horizontal axis.
- Remove Gaps: Right-click the bars, select Format Data Series, and set the gap width to 0%.
- Add Task Names: Use the “Select Data” option to edit the Horizontal (Category) Axis Labels with your Task Names
Step 4: Customize the Chart
Once you’ve selected the right Gantt chart template for your project, it’s time to start customizing it to fit your specific needs. Gantt charts are highly versatile, allowing you to tailor the visual elements, data inputs, and functionality to match your project management style and requirements.
Formatting and Styling
One of the first things you’ll want to do is adjust the formatting and styling of your Gantt chart. This includes:
- Color-coding : Use different colors to represent various project elements, such as task status, resource assignments, or milestone types. This can help you quickly identify important information at a glance.
- Gridlines and borders : Adjust the thickness, color, and visibility of gridlines and borders to improve readability and emphasize key information.
- Font styles and sizes : Choose fonts and font sizes that are easy to read, both on-screen and when printed.
- Shading and highlighting : Use shading or highlighting to draw attention to critical tasks, dependencies, or other important project details.
Adding Custom Data Fields

Stop exporting data manually. Sync data from your business systems into Google Sheets or Excel with Coefficient and set it on a refresh schedule.

Gantt charts in Excel allow you to add custom data fields to track additional project information. Some examples include:
- Task dependencies : Identify task relationships and dependencies to better understand project flow.
- Resource assignments : Assign specific resources (people, equipment, etc.) to each task.
- Actual vs. planned dates : Compare planned start and end dates with actual progress to identify delays or areas for improvement.
- Budget and cost information : Integrate budget and cost data to monitor project spending.
By incorporating these custom data fields, you can gain deeper insights into your project and make more informed decisions.
Step 5: Update the Chart
As your project progresses, regularly update the Gantt chart to reflect:
- Changes in Task Status: Mark tasks as completed, in progress, or delayed.
- Timeline Adjustments: Modify start and end dates as project timelines evolve.
- Resource Reallocation: Adjust resources as needed to meet project demands.
- Task Update: Mark “Market Research” as completed on June 10, 2024.
- Timeline Adjustment: Extend the “Product Design” end date if delayed.
Gantt Chart Templates 101: The Basics
A Gantt chart is a type of bar chart that illustrates a project schedule, displaying the start and end dates of the various tasks or activities that make up a project. These charts are named after their inventor, Henry Gantt, who developed the concept in the early 20th century.
Gantt charts are invaluable for project management because they provide a clear, visual representation of a project’s timeline, allowing you to easily track progress, identify dependencies, and make informed decisions about resource allocation.
By using a Gantt chart, you can:
- Visualize the sequence and duration of tasks within a project
- Identify dependencies between tasks and potential bottlenecks
- Monitor the progress of individual tasks and the overall project
- Communicate the project plan and timeline to stakeholders
Why Use a Gantt Chart Template?
Gantt charts are versatile and can be used for a wide range of projects, from small-scale personal endeavors to large-scale enterprise initiatives. Their ability to organize and communicate complex information in a simple, easy-to-understand format makes them an indispensable tool for project managers and teams of all sizes.
While creating a Gantt chart from scratch is possible, using a template can save you time and effort. Here are some reasons why:
- Time-saving: With a template, you don’t have to worry about setting up the basic structure of the chart. Simply input your project data, and you’re ready to go.
- Consistency: Templates ensure that all your Gantt charts follow a consistent format, making them easier to read and understand across different projects.
- Customizability : Most templates are customizable, allowing you to tailor them to your specific project needs. You can add or remove columns, change colors, and adjust timelines as needed.
- Ease of use: Many Gantt chart templates are designed with user-friendliness in mind. Even if you’re new to Gantt charts, you’ll find them intuitive and easy to work with.
Don’t Create a Gantt Chart from Scratch
Gantt chart templates in Excel can make project management more efficient. By customizing these templates and applying useful techniques, you’ll improve your workflow and project tracking. Coefficient’s free Gantt chart templates offer a solid starting point for your projects.
These templates, combined with real-time data connections, can help you stay on top of project timelines and tasks. Ready to try it out? Get started with Coefficient today!
Connect Google Sheets or Excel to your business systems, import your data, and set it on a refresh schedule.
5.0 Stars - Top Rated
Try the Spreadsheet Automation Tool Over 425,000 Professionals are Raving About
Tired of spending endless hours manually pushing and pulling data into Google Sheets? Say goodbye to repetitive tasks and hello to efficiency with Coefficient , the leading spreadsheet automation tool trusted by over 350,000 professionals worldwide.
Sync data from your CRM, database, ads platforms, and more into Google Sheets in just a few clicks. Set it on a refresh schedule. And, use AI to write formulas and SQL, or build charts and pivots.

Trusted By Over 50,000 Companies

3: Gantt chart for the project's current progress and the remaining time plan – Set on 15 th July 2011

Contexts in source publication
- Recruit researchers
- Join for free
- Login Email Tip: Most researchers use their institutional email address as their ResearchGate login Password Forgot password? Keep me logged in Log in or Continue with Google Welcome back! Please log in. Email · Hint Tip: Most researchers use their institutional email address as their ResearchGate login Password Forgot password? Keep me logged in Log in or Continue with Google No account? Sign up

Proposal Maker
Before starting a project or any activity in an organization, there’s always a need to share this idea. Sharing it to a group would result in a much more outstanding proposition. Take, for example, a proposal for a project which needs to be evaluated and thought over before its implementation.
Creating proposals needs a lot of thinking. There are numerous factors that need to be speculated. It needs to be discussed and of course, be approved by someone of high position. Writing grant proposals are very significant too, for this is mostly what the executives will be taking note of.
- Simple Proposal Formats
- Project Proposal Examples
59+ Proposal Examples
Sample proposal example.
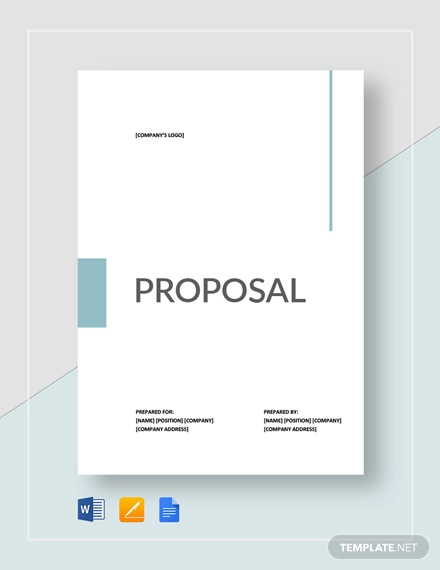
- Google Docs
- Editable PDF
Size: A4, US
Project Proposal Example
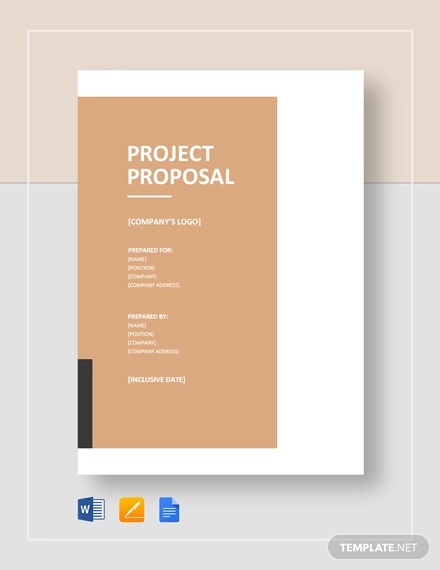
Social Media Proposal Example
Sample Proposal Template
- Apple Pages
Size: 76.3 KB
Size: US, A4
Research Proposal Examples
Research proposal template.
Size: 52.7 KB
Research Proposal Flowchart Template
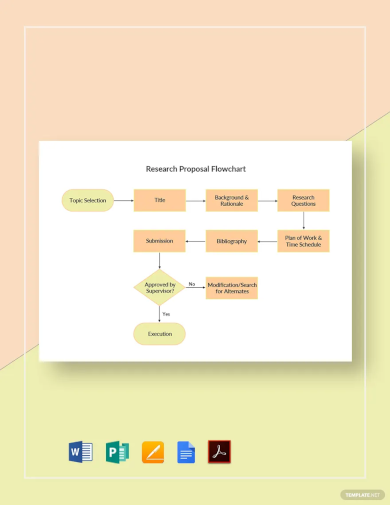
- MS Publisher
Size: 47.8 KB
Research Proposal White Paper Template
Nursing Research Proposal Template
Size: 46.7 KB
University Research Proposal Template
Size: 42 KB
One Page Research Proposal Template
Marketing Research Proposal Template
Medical Student Research Proposal
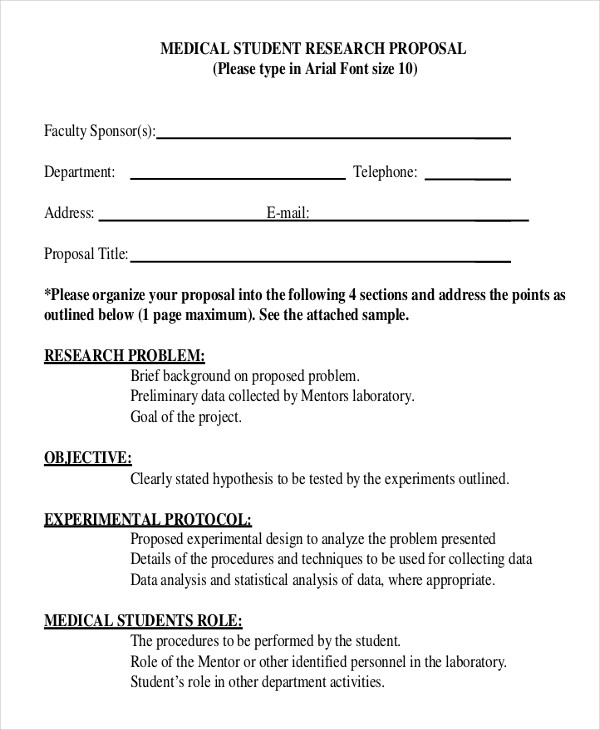
Size: 294 KB
Undergraduate Research Project Proposal Example
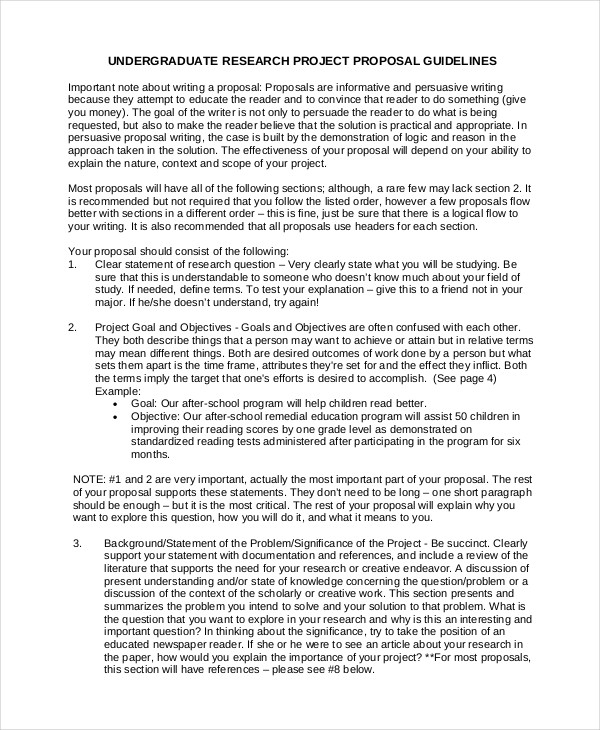
Size: 13 KB
Research Proposal Format Example
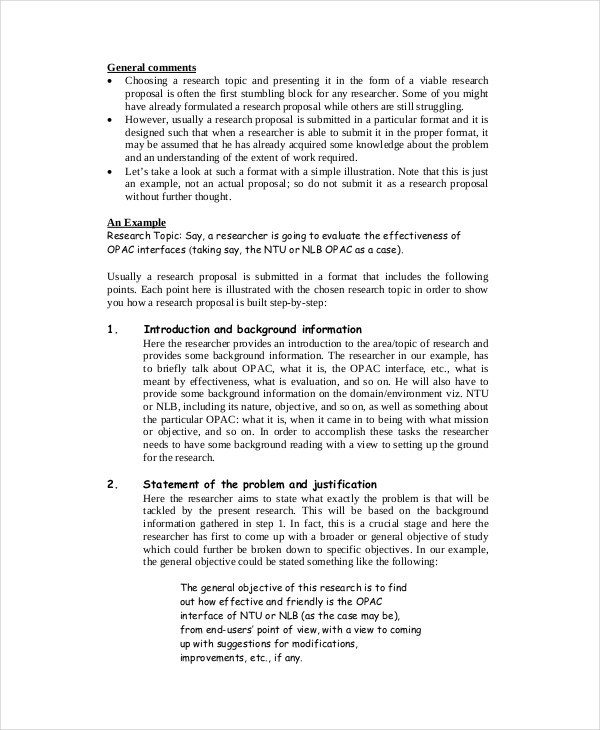
Size: 43 KB
Qualitative Research Example
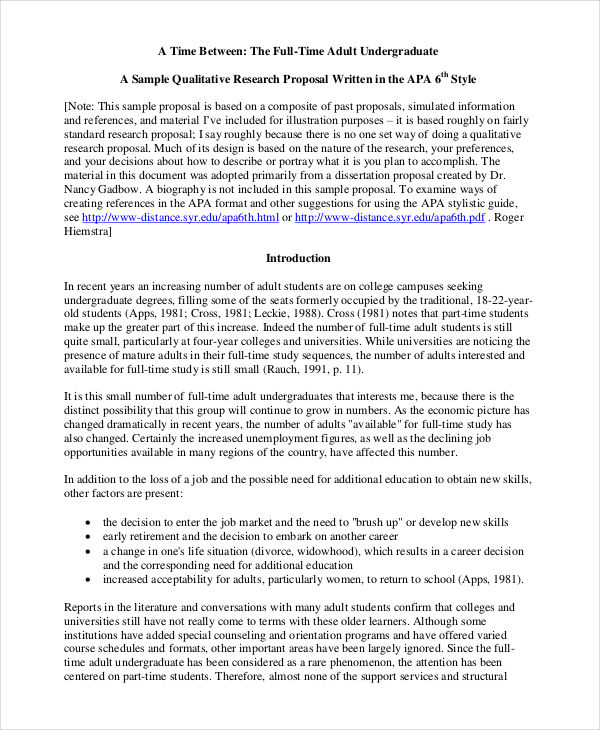
Size: 90 KB
Project Proposals
It project proposal template.
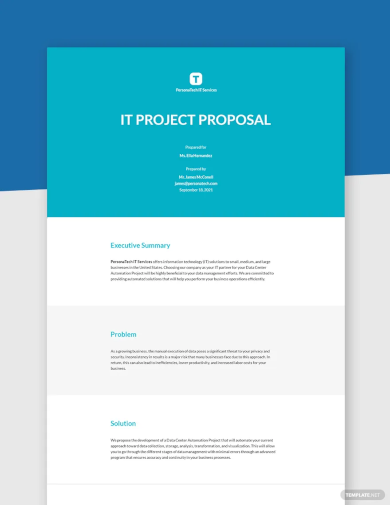
Size: 45 KB
Project Proposal Template Example
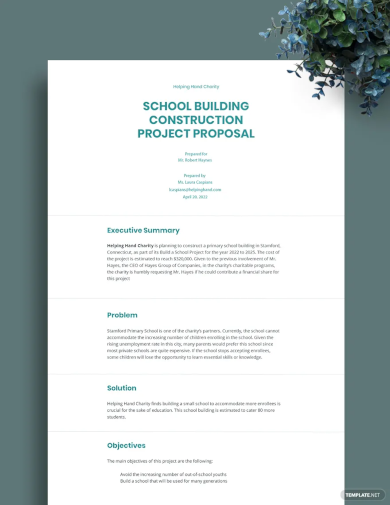
Size: 100 KB
Business Project Proposal Template
Size: 114 KB
Engineering Project Proposal Template
Size: 88.4 KB
Funding Project Proposal Template
Size: 133 KB
Film Project Proposal Example
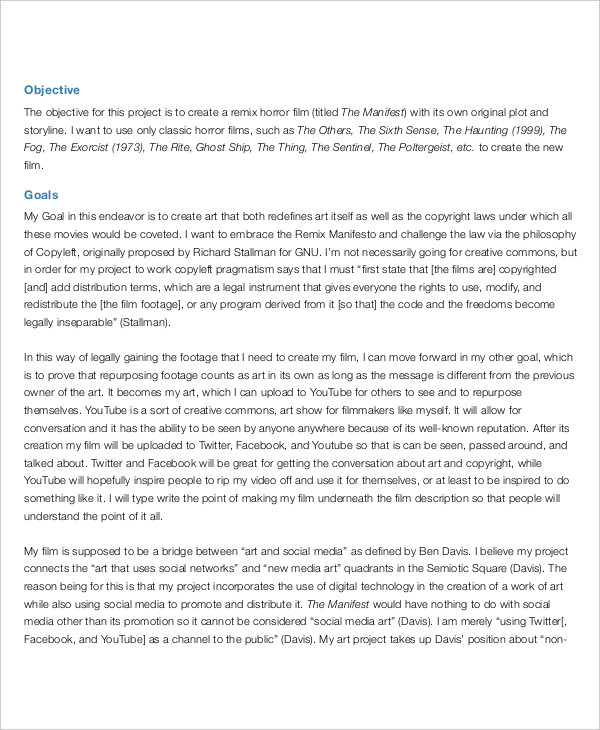
Size: 307 KB
Major Project Sample Example
Size: 21 KB
Group Project Example
Size: 125 KB
Sample Proposal Form Example
Size: 203 KB
Business Proposals
Business proposal template.
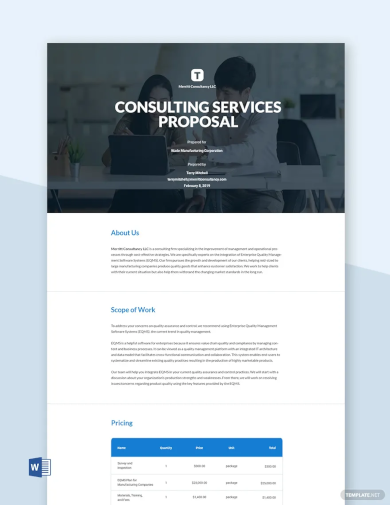
Size: 101 KB
Restaurant Business Proposal Template
Size: 150 KB
Sample Cleaning Business Proposal Template
Size: 36 KB
Small Business Proposal Example
Size: 174 KB
Business Proposal Checklist Example
Size: 188 KB
Business Application Form Example
Size: 219 KB
Thesis Proposal Examples
Thesis proposal template.
Size: 80 KB
Thesis Proposal Gantt Chart Template
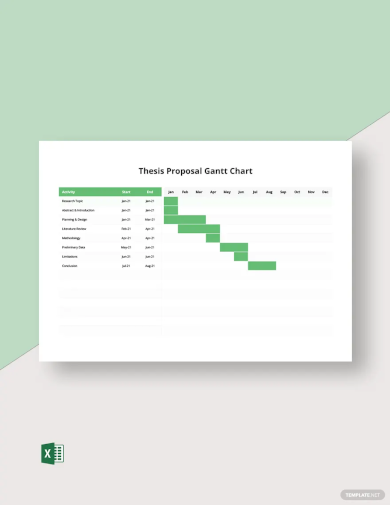
Size: 30 KB
Thesis Outline in PDF
Size: 118 KB
Masters Thesis Proposal Outline Example
Size: 15 KB
Free PhD Thesis Proposal Example
Sociology Thesis Example
Size: 25 KB
Dissertation Proposal
Dissertation proposal template.
Size: 124 KB
Free Dissertation Progress Report Example
Size: 51 KB
Dissertation Proposal Outline Example
Size: 160 KB
Doctoral Dissertation Example
Size: 41 KB
MBA Dissertation Proposal Example
Proposal Letters
Proposal introduction letter example.
Free Proposal Application Example
Size: 518 KB
Project Proposal Letter Example
Size: 82 KB
Internship Proposal Letter Example
Size: 64 KB
Budget Proposals
Simple budget proposal template.
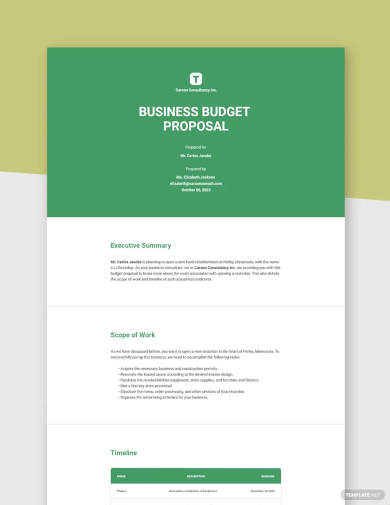
Size: 49 KB
Business Budget Proposal Template
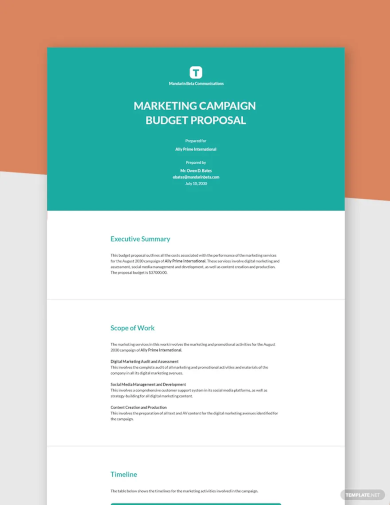
Size: 52 KB
Assembly Budget Example
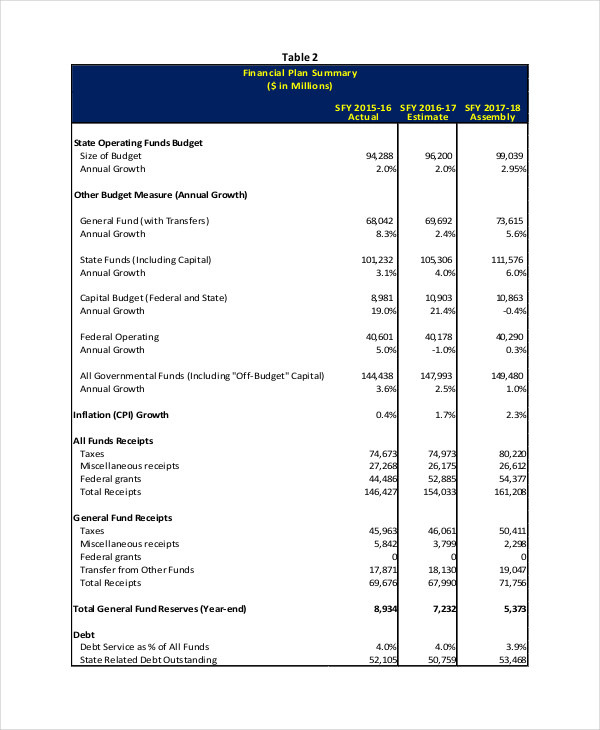
Grant Budget Proposal Example
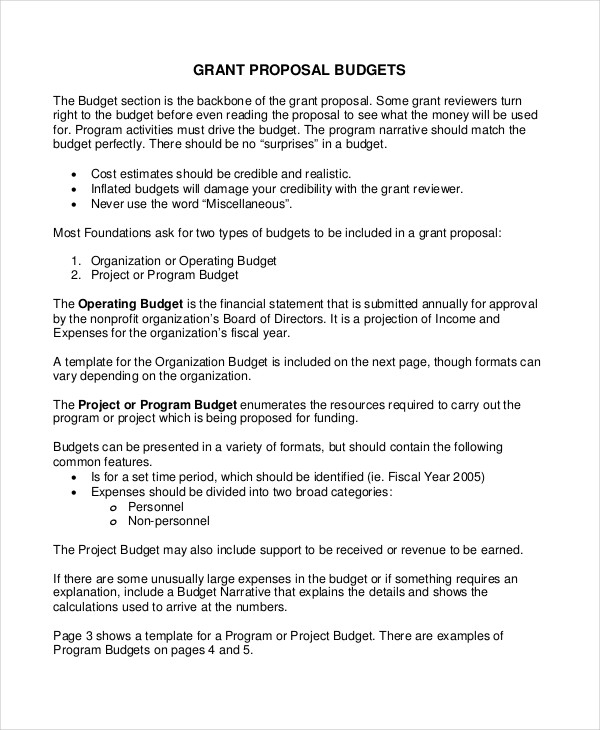
Size: 356 KB
Capital Budget Proposal Example
Size: 237 KB
Conference Proposals
Conference sponsorship example.
Size: 363 KB
Annual Conference Proposal
Size: 195 KB
Conference Proposal Form Example
Size: 131 KB
Event Proposal Samples
Cultural event proposal example.
Size: 139 KB
Free Event Design and Production Example
Size: 32 KB
Event Sponsorship Proposal Example
New Event Proposal Example
Size: 152 KB
Financial Proposals
Technical and financial proposal example.
Size: 212 KB
Financial Request Example
Size: 230 KB
Financial Proposal Form Example
Size: 94 KB
Technical Proposals
Technical paper example.
Size: 435 KB
Technical Proposal Checklist
Size: 176 KB
Technical Budget Proposal
Size: 57 KB
Database Proposals
Database project example.
Size: 671 KB
Database System Proposal Example
Size: 1015 KB
Grant Proposals
Filmmaking grant proposal.
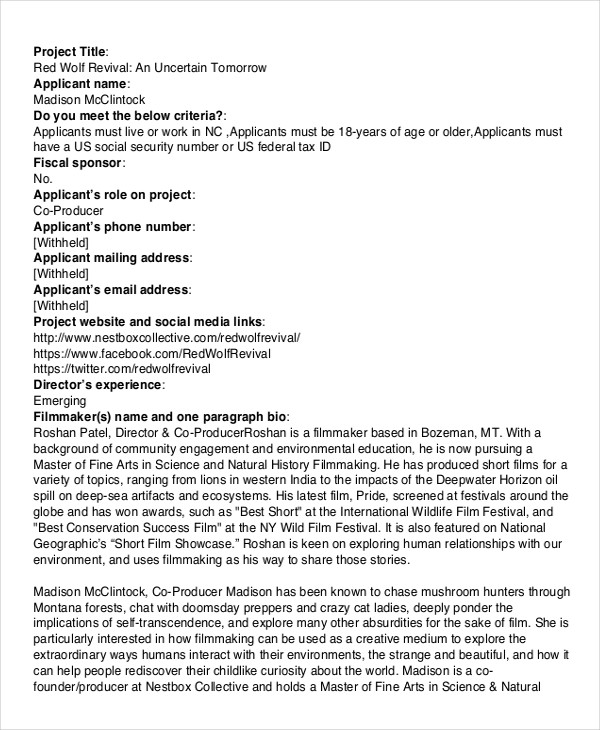
Size: 374 KB
Grant Proposal Form Example
Size: 207 KB
Grant Proposal Checklist Example
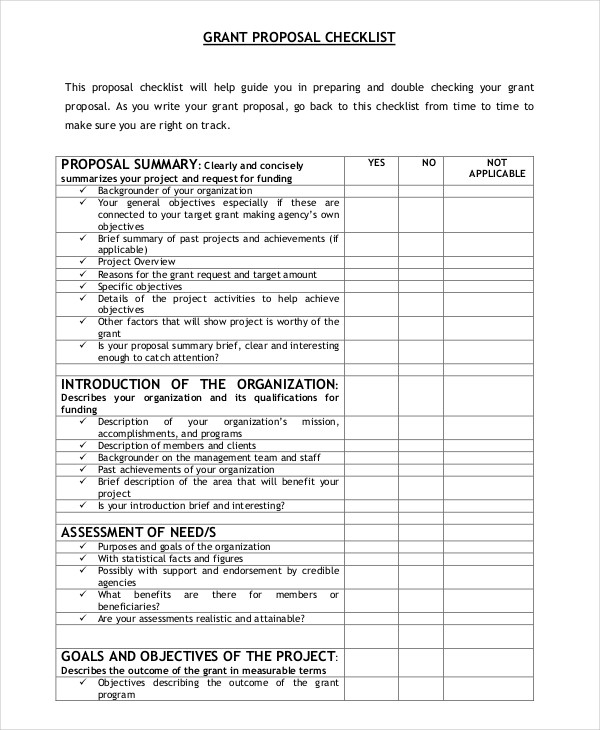
Marketing Proposals
Digital marketing proposal.
Size: 654 KB
IT Marketing Proposal Example
Real Estate Services Marketing
Report Proposal Samples
Final report example.
Size: 745 KB
Proposal Outline Report Example
Size: 530 KB
Restriction Report Proposal
Sales Proposals
Sales business proposal.
Size: 39 KB
Sales Marketing Proposal
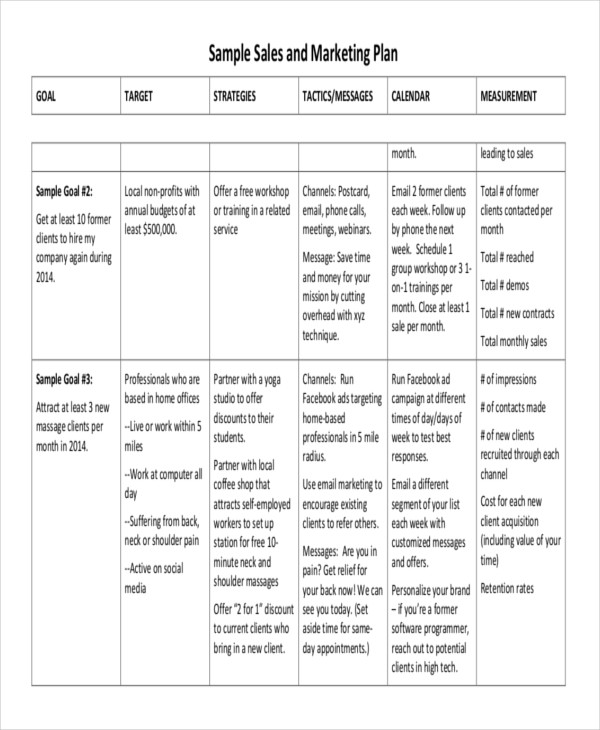
Size: 309 KB
Short Sales Example
Size: 182 KB
Training Proposals
Training program proposal.
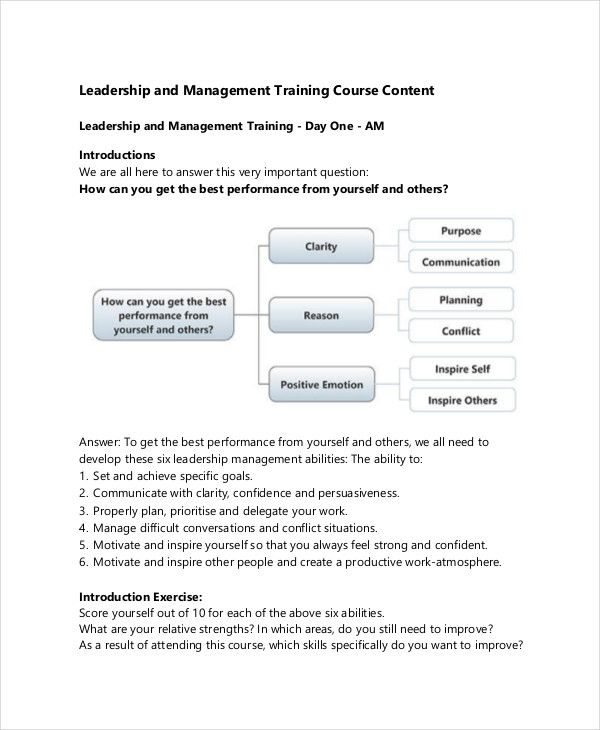
Company Training Example
Size: 157 KB
On-the-Job Training Proposal
Size: 130 KB
Fellowship Training Example
What Is a Proposal?
Proposal examples are written propositions that are addressed to clients or by any department to its head executives. It contains ideas that would be beneficial to an organization. There are many types of proposals, such as a budget proposal and event proposal.
Proposals aim to be approved by the people involved. Writing a proposal , you have to ensure that all is well thought of. It is important for a proposal to be organized, structured, complete, and clear. You can make proposals in a way you see best and most understandable.
A Business Proposal and What It Holds
One type of proposal is the business proposal . This proposal aims to grab a client to invest in their organization. These proposals mostly address clients, who would potentially purchase goods and services.
There are no specific formats for a business proposal. What matters is its content that delivers a complete and clear concept. Its important elements are:
- Cover letter or page
- Table of Contents
- Overview of the Problem
- Method of Solving the Issue
- Company’s Qualification
- Benchmarks (or Schedule)
- Total Expenditure
The length of the proposal is insignificant. It focuses more on how information is communicated.
Guidelines for Writing a Proposal
Writing a proposal is a skill. Though it’s an easy way out to just follow proposal examples , it’s different when making an original one. Don’t get discouraged, we have prepared a few samples for your reference. Plus, here are tips and guidelines to make your proposal effective and more attractive.
1. Planning a Proposal
- Know the people who will be reading it : Understanding what the reader will want to hear is important. When writing a proposal , keep in mind what you want your readers to understand. You may also see sponsorship proposal examples & samples .
- Determine the issue of which your proposal is aiming to resolve: You have to make sure that the readers understand the problem, the situation and has it been dealt with before.
- Unravel solutions to those problems and issues : Make it straightforward and easy to understand. Keep a narrow perspective of the problem and foresee outcomes. You may also like investment proposal examples .
- Apply a writing technique that would make it easier for readers to understand : Keeping it simple yet persuasive is much more meaningful.
- Make use of an outline : This keeps a proposal organized, and will help you deliver what you desire. You may also check out request for proposal examples .
2. Writing the Proposal
- Impress your readers with a firm introduction : Make sure you catch the attention of the readers and keep them interested. You may also see policy proposal examples & samples .
- State the issues clearly and completely : Determine the causes and effects of these issues.
- Issues should have solutions : Explain how to address these issues, why in this manner, and what is expected to be achieved. You may also like concept proposal examples & samples .
- Include a well-constructed schedule of duties and budget : Be as accurate as possible making sure that benefits outweigh costs.
- Wrap up everything in a short but on-point way : Keep your content to a minimum and precise. Do not beat around the bush, but be straightforward with what you can offer.
- Keep an open mind and let others assess your work : Edit your work and proofread to make sure there are no mistakes. You may also check out fundraising proposal examples & samples .
What Is a Research Proposal?
Aside from business proposals , there are other kinds of proposals that anyone can encounter, such as a research proposal. What is a research proposal?
A research proposal is the written proposal for a research paper that aims to convince the reader that there is a need for a research study to be conducted and needs financial aid for the research to be successful. You may also see non-profit proposal examples & samples . Research proposals present all that will be done during the research, what it is for, and what benefits are expected to be achieved at the end.
What Is a Grant Proposal?
There are organizations that operate with the purpose of serving the people and not for profit accumulation, like charities, government branches, foundations, and trusts. You may also like partnership proposal examples & samples . Therefore, to acquire funds that are needed for that organization, grants have to be issued.
A grant proposal is a document requesting funds to achieve a certain undertaking. These kinds of design proposals are used by any government entity asking for monetary assistance to be prepared for operations like improving roads, building facilities that would benefit the society, scholarships, research, charities or cases wherein a calamity has devastatingly affected a community.
Types of Proposals
Reaching this point, you have seen different types of proposals. To better understand, here are brief summaries of the different types of proposals:
1. Unsolicited Proposal: Unsolicited proposals are proposals where no instructions regarding submission of proposals are made but are submitted anyway to catch the potential sponsor’s interest. Some business loan proposals are unsolicited and may be submitted anytime.
2. Solicited Proposal: Solicited proposals is a response to any specific program that is issued by any organization. Proposals of this kind usually have deadlines. Take a look at the security proposal examples that are online for more.
3. Supplemental Proposal: There are instances that the current budget is not enough for the current project. To acquire more funds, a request for an increase in the budget is made in the form of a supplemental proposal.
4. Competing Renewal Proposal: A proposal is made to request sponsors for continued funding for a project proposal that is about to terminate. These type of proposals are like newly-made proposals that need to be approved in the same manner as the new one.
5. Non-competing Proposal: This type of proposal is a request for the succeeding year’s funding, including the progress report of the project, the budget, etc. It also has the schedule of duties, changes or updates, and other relevant information about the project. You may also see grant proposal examples .
General FAQs
1. define a proposal..
A proposal is a written plan or a suggestion put forward for consideration by others. It is mostly formal. Business proposals are sent to the prospective client to obtain specific jobs. Also used by a seller, who writes to a buyer to know if he/she wants to buy certain services/goods from the seller.
2. Why is a Proposal important?
Proposals are a way to pitch an idea and state your requirements. It is important because it provides information in writing and you can act knowing the implications of your choices and decisions. Proposals help in making a structured and logical argument to lay down every idea and point in your favor.
3. What should a Proposal cover?
Proposals must cover the following:
- Introduction: a brief overview of the issues, costs, and benefits
- Issue: The subject, the reason for the proposal, the main argument, etc.
- Solutions: Step-by-step plan, potential obstacles and how to overcome them
- Qualifications: Your personnel requirement, experience, etc.
- Conclusions: Add the budget , benefits and reinforce your final point.
4. What makes a Good Proposal?
Preparing a winning proposal means that you are writing for the client and are proving a clear solution to their issues. Not every proposal you make is accepted by the client, so make sure that you make it from the point of view that is beneficial to the client.
5. What is the best way to conclude a Proposal?
The best way to conclude a proposal can be:
- To summarize the key points of your proposal
- Focus on why action is needed
- Emphasize the benefits the action provides
- Add bullet points of essential information
- Add verbal highlights of your key benefits
- Close on a positive note and ask them to take action.
Text prompt
- Instructive
- Professional
Generate a proposal for a new school recycling program
Compose a proposal for a school field trip to a science museum.

IMAGES
VIDEO
COMMENTS
At its core, a Gantt chart consists of two main components: tasks and time. The tasks related to the project are listed on the vertical axis, while the horizontal axis represents time. Each task is represented by a horizontal bar, the length of which corresponds to the duration of the task. Make your own Gantt chart in Gleek.
Common Mistakes to Avoid When Using a Gantt Chart for Research Proposals. When using a Gantt chart for your research proposal, it's crucial to avoid certain pitfalls that can hinder your project's success. Overloading the chart with details can make it difficult to read and manage. Instead, focus on key tasks and milestones to keep it clear and ...
For example, let's say you're creating a research proposal. One of your tasks is to promote awareness and garner support for the proposal on social media. ... A Gantt chart ensures all research project team members clearly understand objectives, deadlines, and task dependency relationships. Best practices for planning and scheduling a ...
21+ Gantt Chart Research Proposal Templates. Gantt charts are a useful productivity apparatus for project management. They are a bar chart derivative for task scheduling and progress tracking. The user plots the activity progress along the y-axis, with respect to the indicated time on the x-axis. The leftmost column contains the list of tasks ...
Learn how your comment data is processed. I want to see a simple project plan (Gantt chart) in every funding application. To make one, you need to: list all the activities in the project; estimate the time required for each activity; put the activities in order; merge any small tasks or similar, repetitive tasks and then draw it up.
Gantt Chart Example for Manufacturing. 1. Gantt charts for project management. CREATE THIS GANTT CHART. Gantt charts can be a helpful visual to include in project management plans. Like the previous example, this retro daily project Gantt chart example breaks down project activities day by day.
Find Gantt chart examples for various industries, and download free completed and blank Gantt chart templates for various formats. ... or download the sample template for a prepared version that shows real data for a research project. In this case, the example is for a clinical trial of a new product. Microsoft Word is a great format option if ...
Step 1: Make a Project Table. The first step in creating a Gantt chart is to make a project table. List all the activities that you plan to do in your research project. This can include tasks such as literature review, data collection, data analysis, and writing the final report. Make sure to include the start and end dates for each activity.
What is a Gantt Chart Research Proposal? A Gantt chart research proposal is a compelling and well-detailed written document which is submitted in order to send a request to prospects such as project managers, operations managers, and other business professionals in companies and organizations with a clear intention of using a Gantt chart timeline for managing and monitoring a certain research ...
Project managers today consider Gantt charts more powerful than just a real-time progress tracker. I gathered input from HR heads, team leads, and project managers to create a list of the 15 best examples of Gantt charts. Check them out below. 1.
First, select the data you want in your bar chart, then click on the Insert tab in the ribbon. Once Excel has created your bar graph, you can give it a project title. To edit the axis labels, right-click your stacked bar chart and choose "Edit" from the insert menu that appears under "Select Data".
Step 2: Make a Bar Chart. You start creating your Gantt chart in Excel by creating a regular Stacked Bar chart. To do this, from the column header, you need to choose a range of your start dates. Make sure that you only select those cells which have data and not the whole column.
What is a Gantt Chart Research Proposal? A Gantt chart research proposal is a useful document that comprises main goals, objectives, and methods or strategies established by the researchers in demonstrating the specific timeline and progress, or the essential tasks and time intervals of a particular project.. How to Create a Gantt Chart Research Proposal
The easy sample Gantt chart For Research Proposal given below describes the method break down in a very simple and effective way. ... The sample can help you in formatting any types of chart models that you need to insert in your important projects. Get customized research proposal along with Gantt Chart from our experts at a 25% discount and ...
The Research Gantt Chart is utilised to represent the project schedule that involves the duration of the individual tasks, the stages and its depencies and ordering. It keeps up the process of the planning by calculating its duration, the identification of resources, and lays out the order in which the resarch work need to be completed. It calculates the starting and the end point of the ...
By clicking "Accept All Cookies", you set to which storage in cookies on your unit to refine site navigation, analyze site usage, and assists in our marketing efforts. More than 30 Professional Gantt Chart Templates available since you instantly in Excel PowerPoint and Word sizes. Checkout out our Gantt Chart Templates!
7. Video Production Template. Producing a video is a lot like producing a product in that there are a whole lot of different steps involved and you have to make sure that you don't miss any of them. If you do you could find yourself struggling to get that video out at all let alone getting people to pay for it.
A Gantt chart is the ideal tool to coordinate groups of people and simultaneous goals and keep all aspects of a plan moving when they're supposed to. With these easy-to-use templates, your Gantt chart can be as colorful and as detailed as your organized heart desires. Make sure everything's going smoothly for your grand opening by know exactly ...
Example: Planning year 2 of a 3-year PhD. Maria completed her first round of data collection according to plan, and starts the second year of her PhD with a lot of material. In her second year, she will focus on turning this data into two journal articles. Months 1-2: Maria works on her data analysis.
Some people make their Gantt chart in Excel, but using Tom's Planner is a lot more flexible and intuitive. Our research project plan example has all the main stages and sub-stages pre-set and grouped in advance for you, all you need to do is insert the actual tasks and set them to the right time and duration.
Gantt Chart Example for Project Proposal. Gantt charts provide a visual roadmap showing project activities, timeframes, and dependencies, and are the core tool in project management. These charts, which have their roots in the important work of Henry L. Gantt, give team members and project managers a clear picture of project timetables and ...
Gantt charts in Excel allow you to add custom data fields to track additional project information. Some examples include: Task dependencies: Identify task relationships and dependencies to better understand project flow.; Resource assignments: Assign specific resources (people, equipment, etc.) to each task.; Actual vs. planned dates: Compare planned start and end dates with actual progress to ...
Download scientific diagram | 3: Gantt chart for the project's current progress and the remaining time plan - Set on 15 th July 2011 from publication: Interim Report: The Analysis of Microarray ...
Before starting a project or any activity in an organization, there's always a need to share this idea. Sharing it to a group would result in a much more outstanding proposition. Take, for example, a proposal for a project which needs to be evaluated and thought over before its implementation. Creating proposals needs a lot of thinking.
Project Site for each projects hosts Tasks, Risk, and Issues list. Our PMs would like to see everything in one place. Gantt view for critical task would be useful for us. Looking for suggestion on how to include Critical field on the existing Gantt Chart. I would like to keep the same view. Any suggestion as to how we could build on top of ...